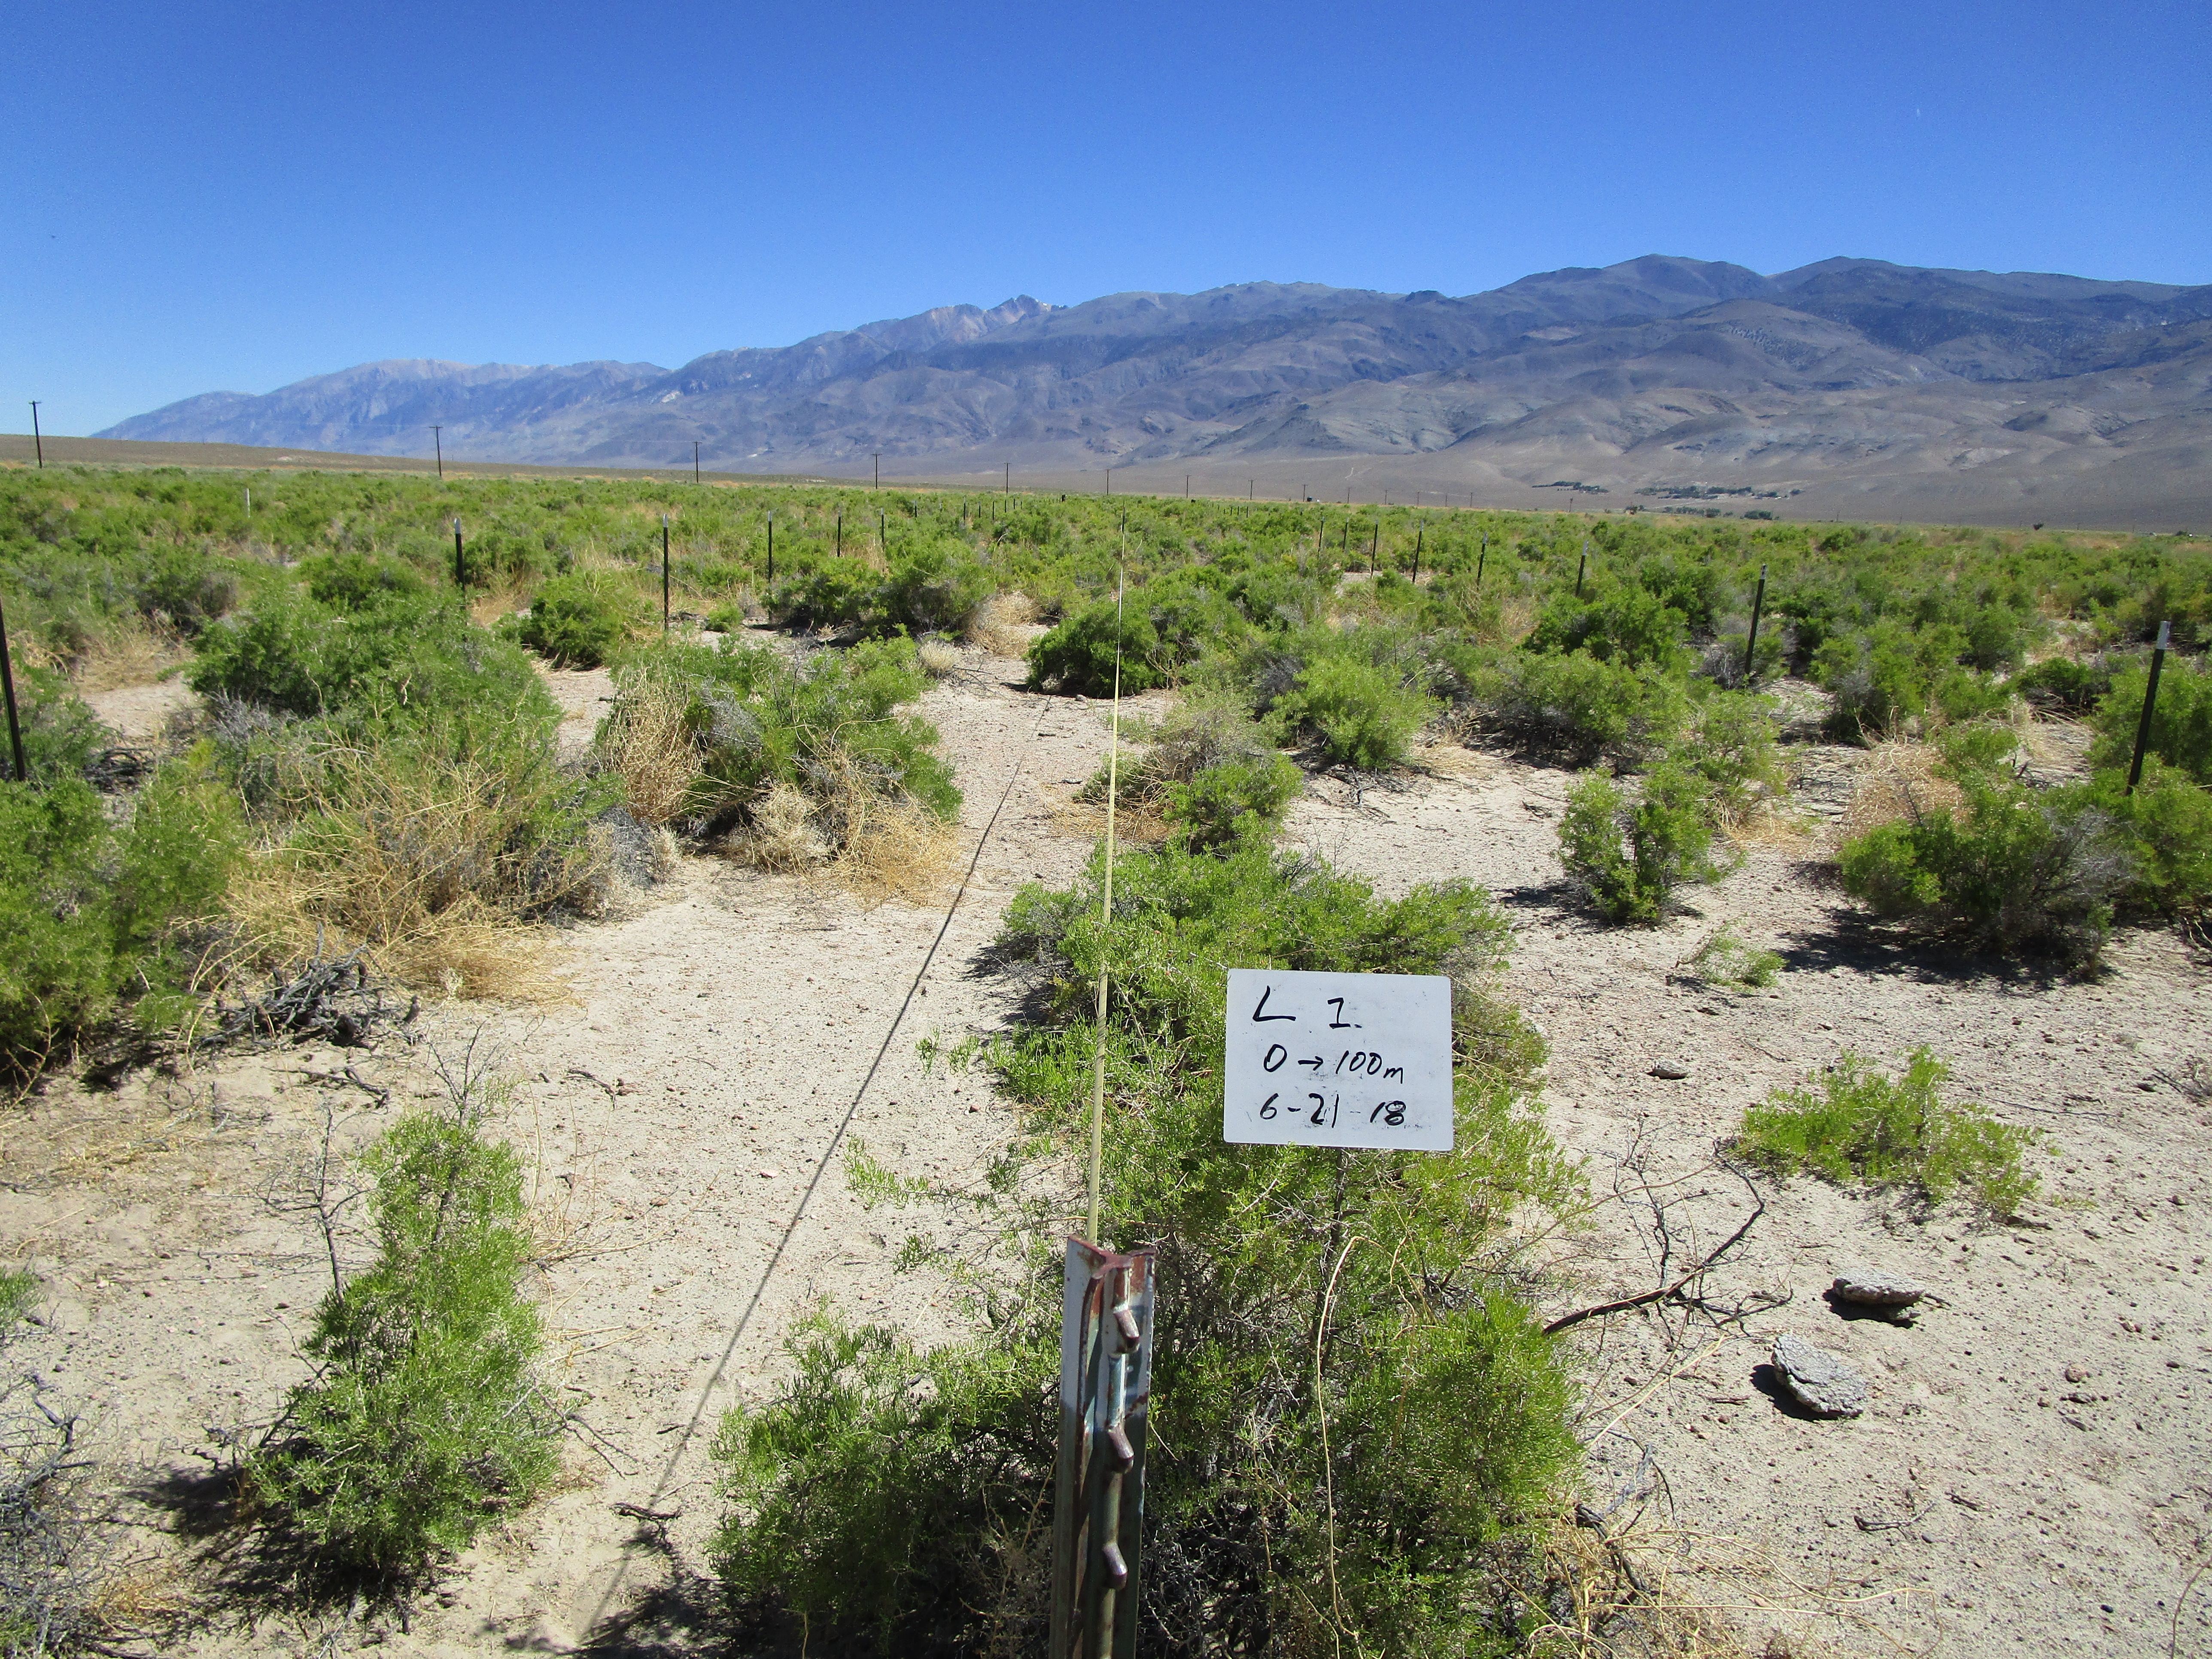
LW1
Laws Monitoring Site #1
- Current status
- ON
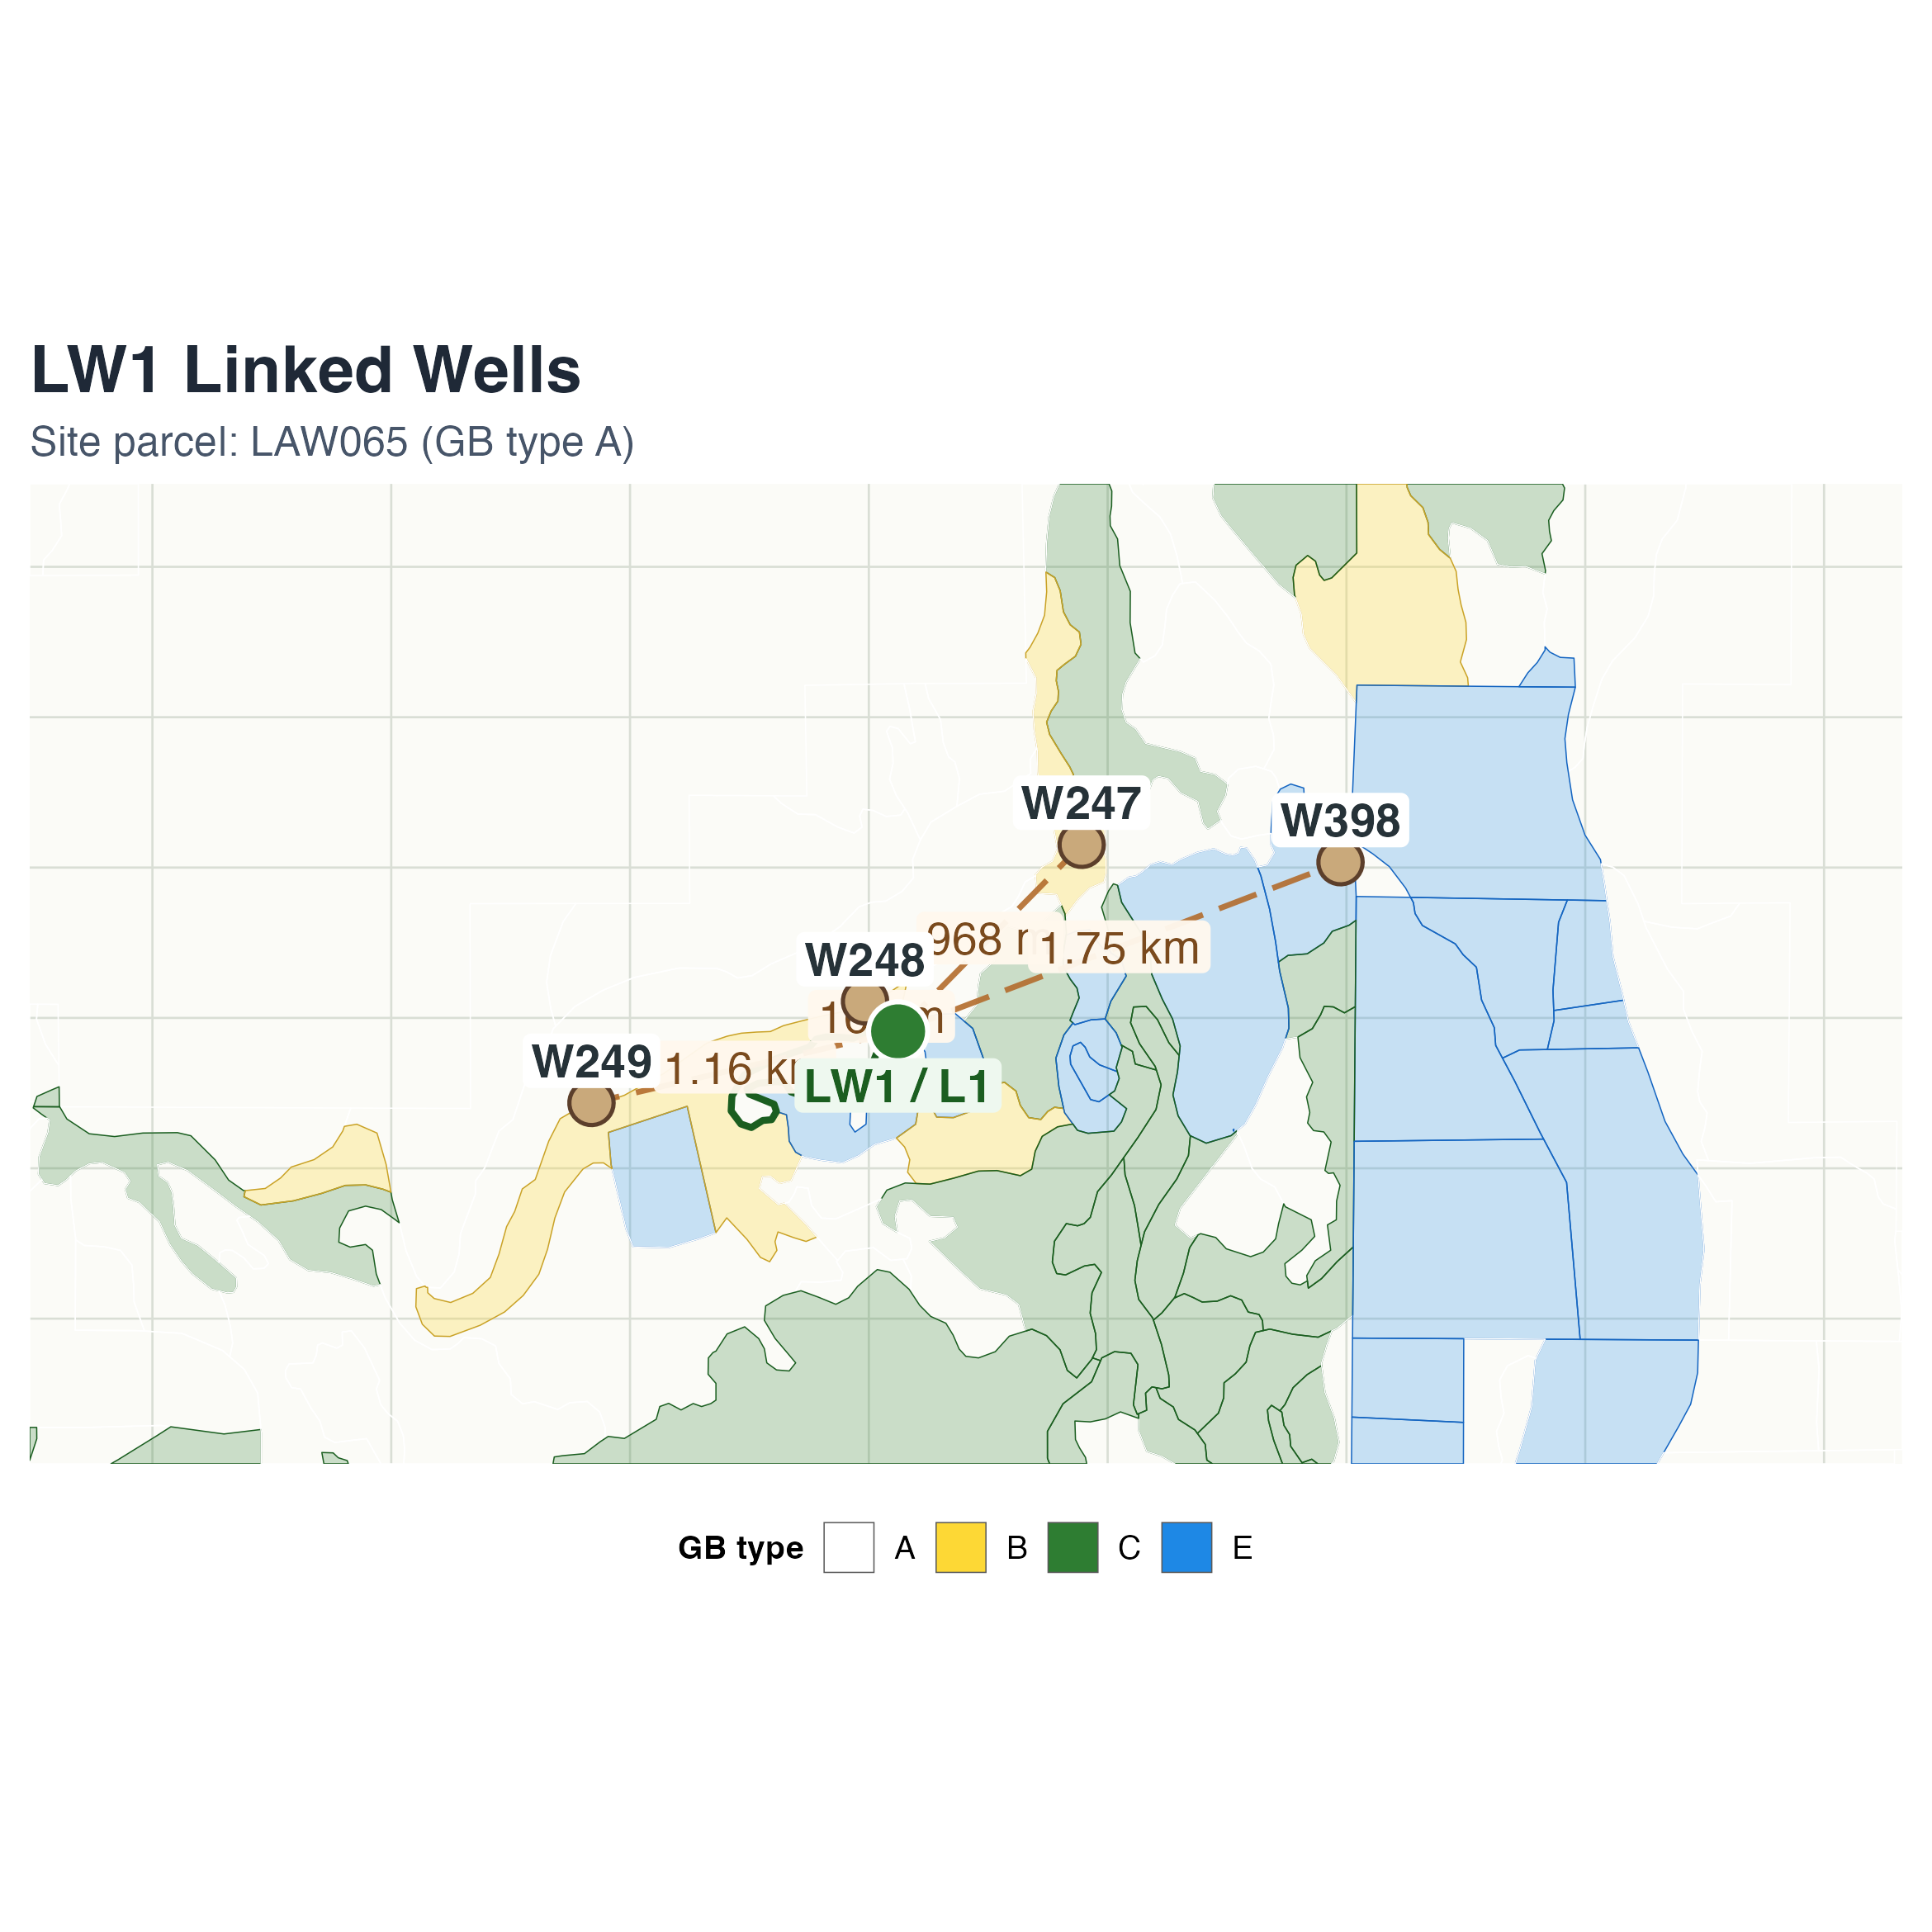
- Linked pumping wells
- 247, 248, 249, 398
- Soil AWC required for turn-on
- NA
- Monitoring well
- 795T
On-off pumping management according to Green Book Section III values for Vegetation Water Requirements 1989-2026.
The Water Agreement and Green Book establish protocols for determining the operational status of LADWP pumping wells based on soil moisture and vegetation measurements. To fulfill monitoring requirements under the Agreement, the Water Department regularly assesses soil moisture content and vegetation leaf area index, in collaboration with LADWP, at 22 permanent sites within wellfields and seven sites in control areas. Soil moisture monitoring occurs monthly, while vegetation monitoring occurs annually in June. Each monitoring site is associated with one or more LADWP pumping wells.
On July 1 and October 1, if soil moisture levels are inadequate to support vegetation needs at a site, the linked pumping wells are placed in off status. They remain offline until soil moisture levels exceed the threshold required by the vegetation at the time the linked wells entered off status. This operational approach is known as the on/off management strategy.
Since the strategy began in 1990, LADWP has frequently maintained numerous wells in off status, consistent with subsequent agreements with the County.
Data for each permanent monitoring site (1990-present) are presented in three linked plots. The first plot shows pumping from linked production wells. The second shows available water content (AWC) and vegetation water requirements (VWR) over time. The third shows depth to water (DTW) from the associated monitoring well. Green shading marks periods when the site was in on status; off periods are unshaded.
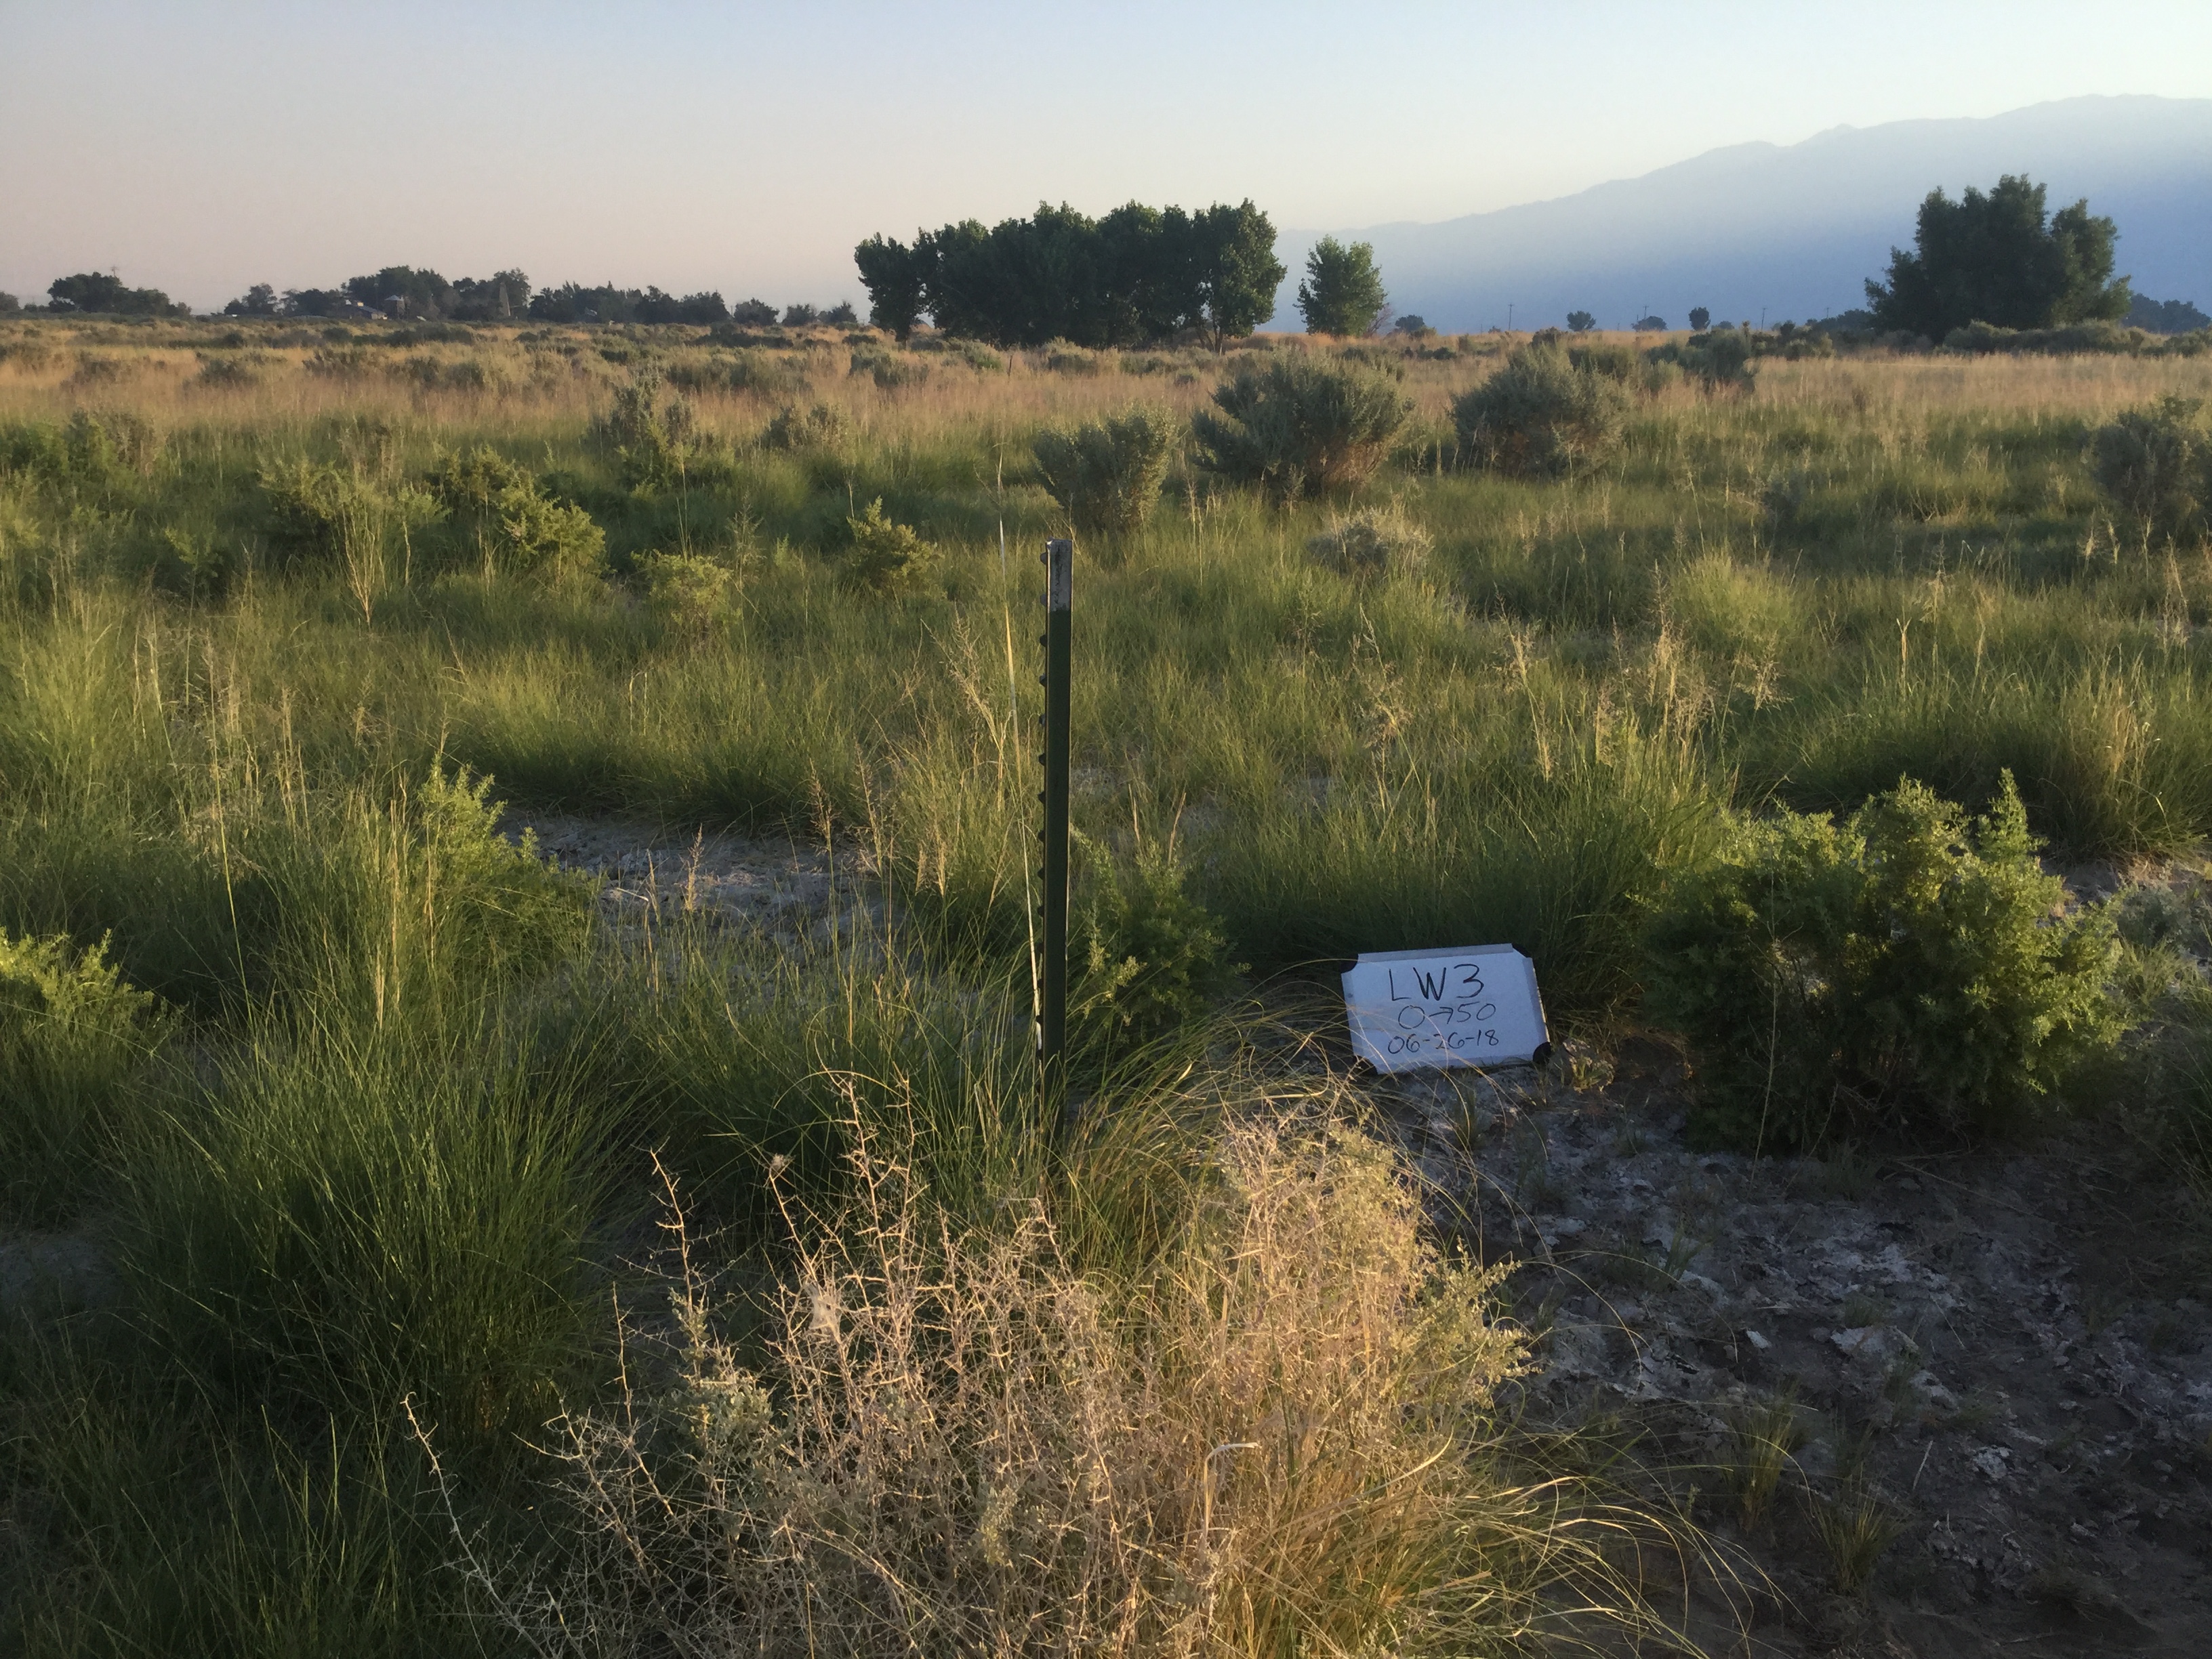
Each site starts with a compact card showing the site photo, linked production wells, current on/off status, AWC required for well turn-on, and the associated monitoring well.
Instructions
Zoom out: Double-click a plot to return to the full time-series extent.Data point highlighting: Move the cursor over a plot to display data values in the legend.Zoom in: Drag horizontally to select a time period or vertically to select a custom y-axis range.Grouped selection: Selecting a time period in one plot updates all plots.LW1
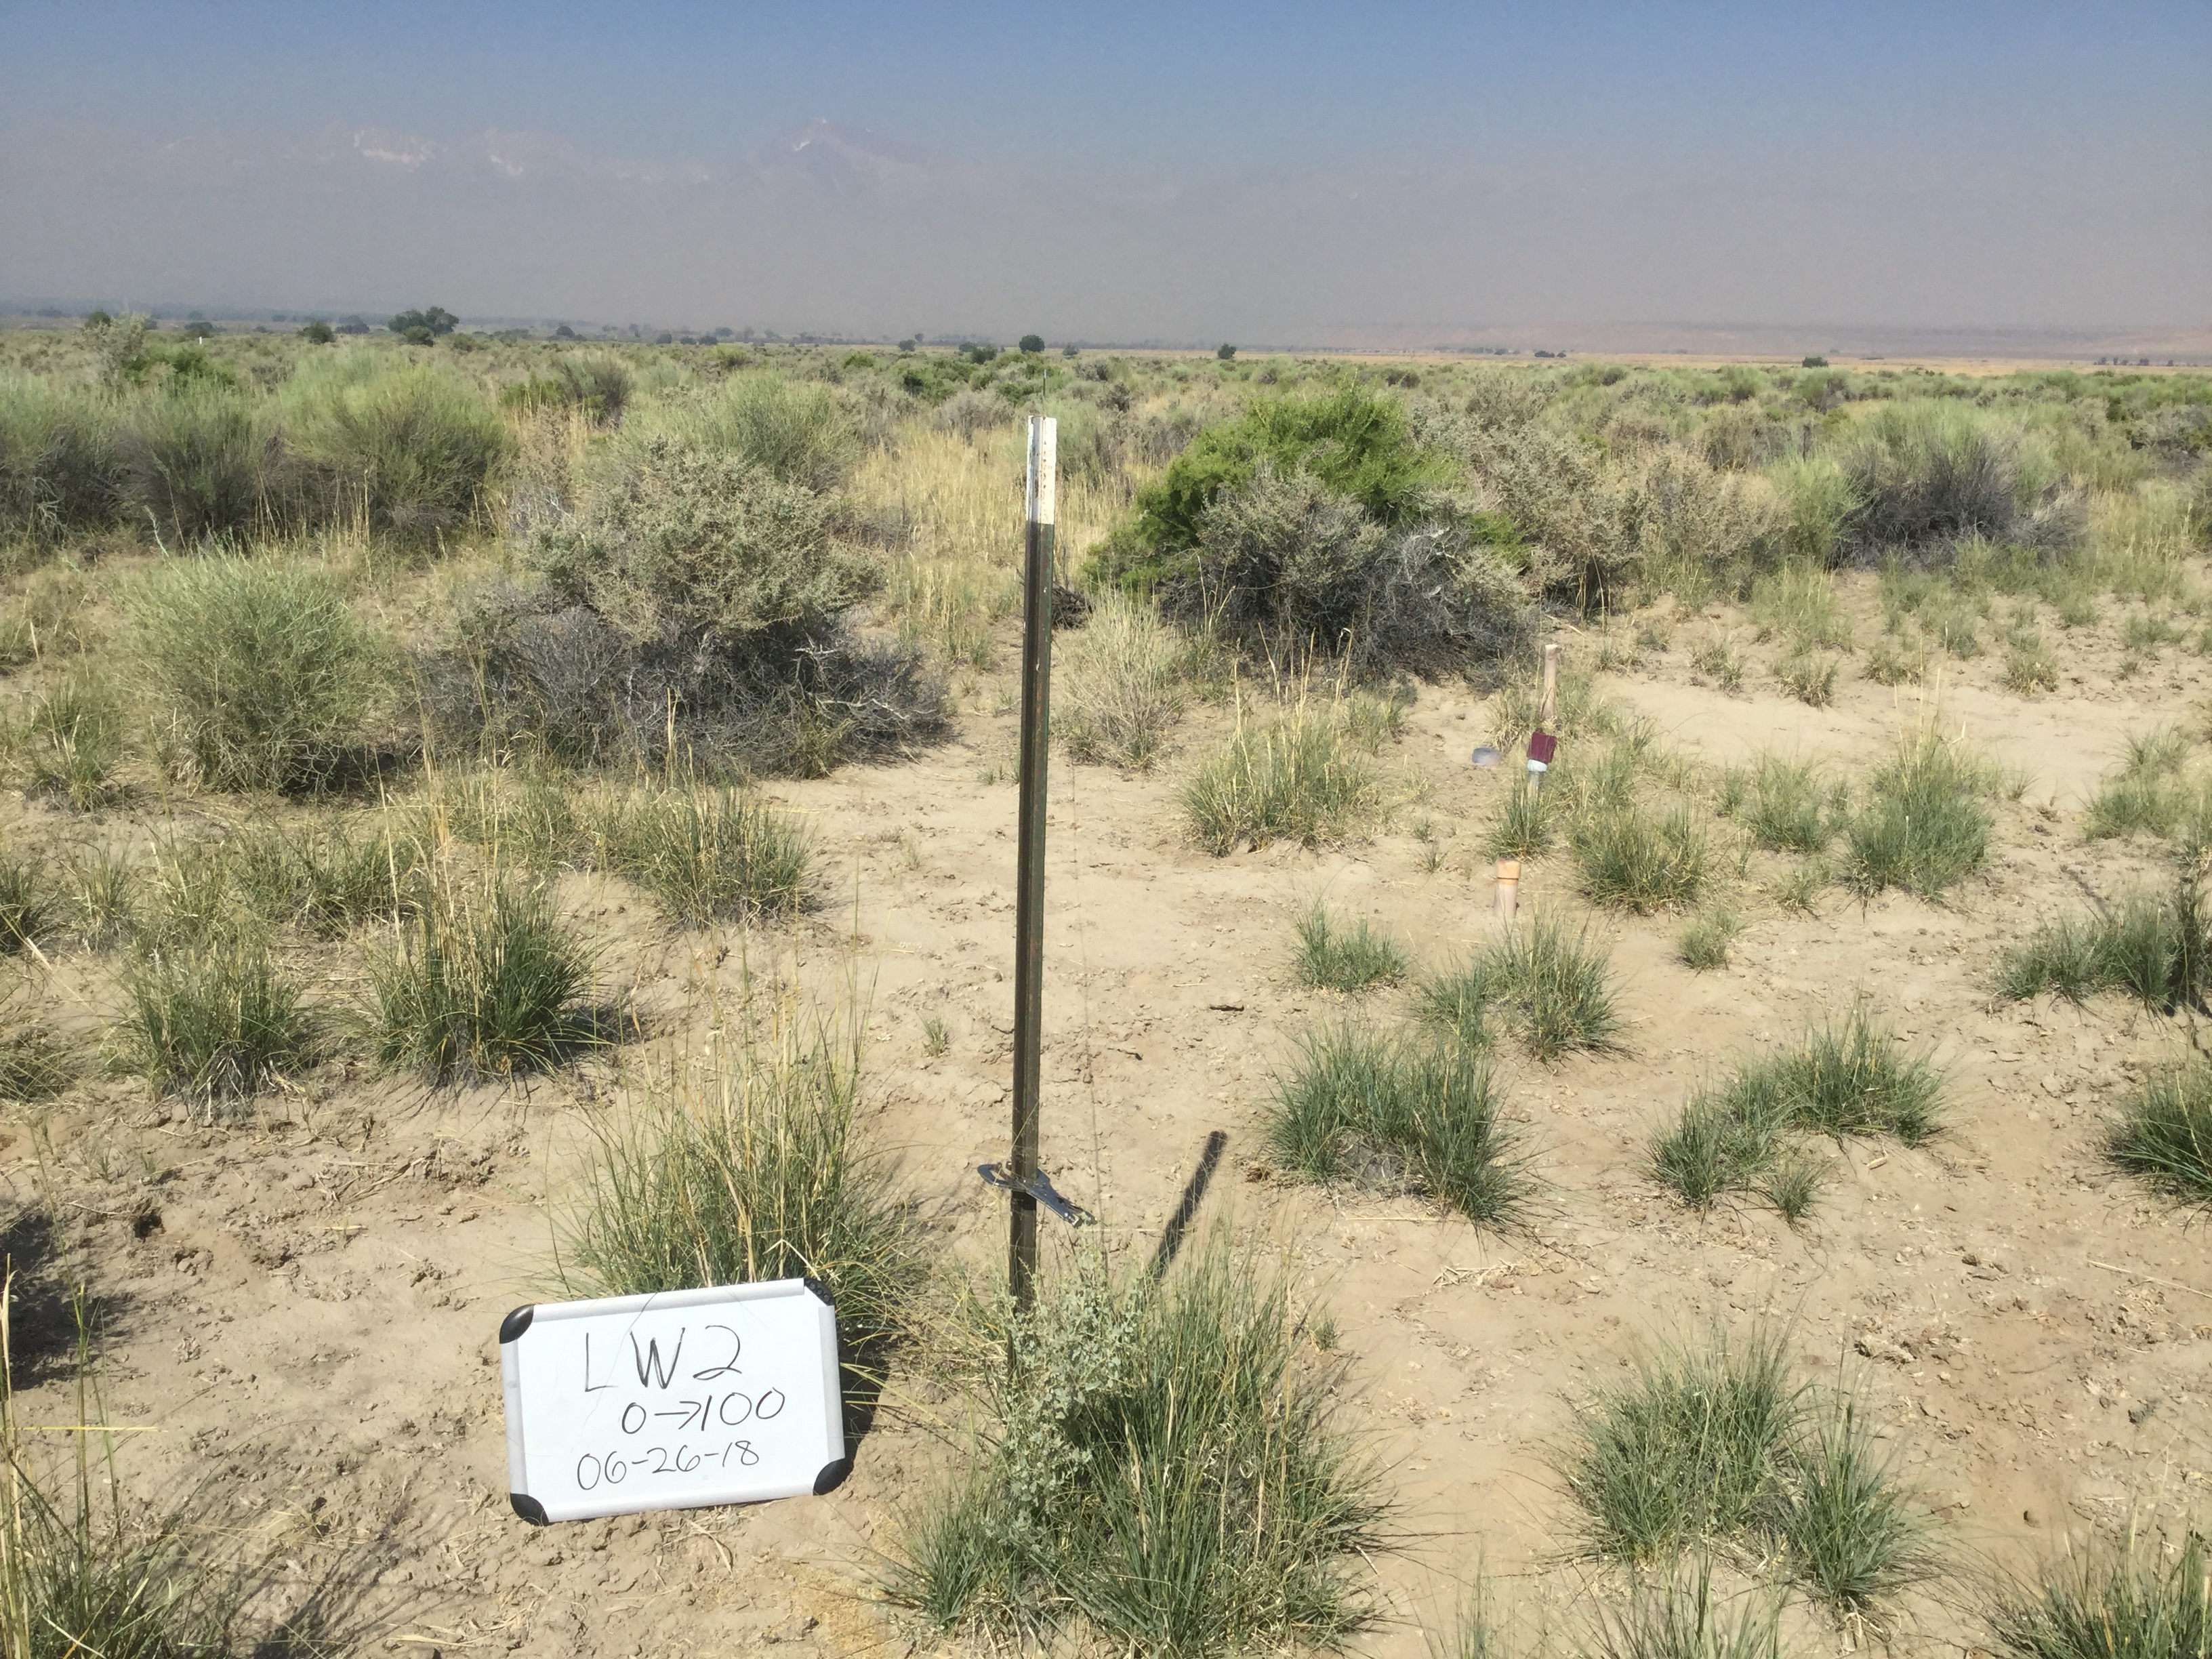
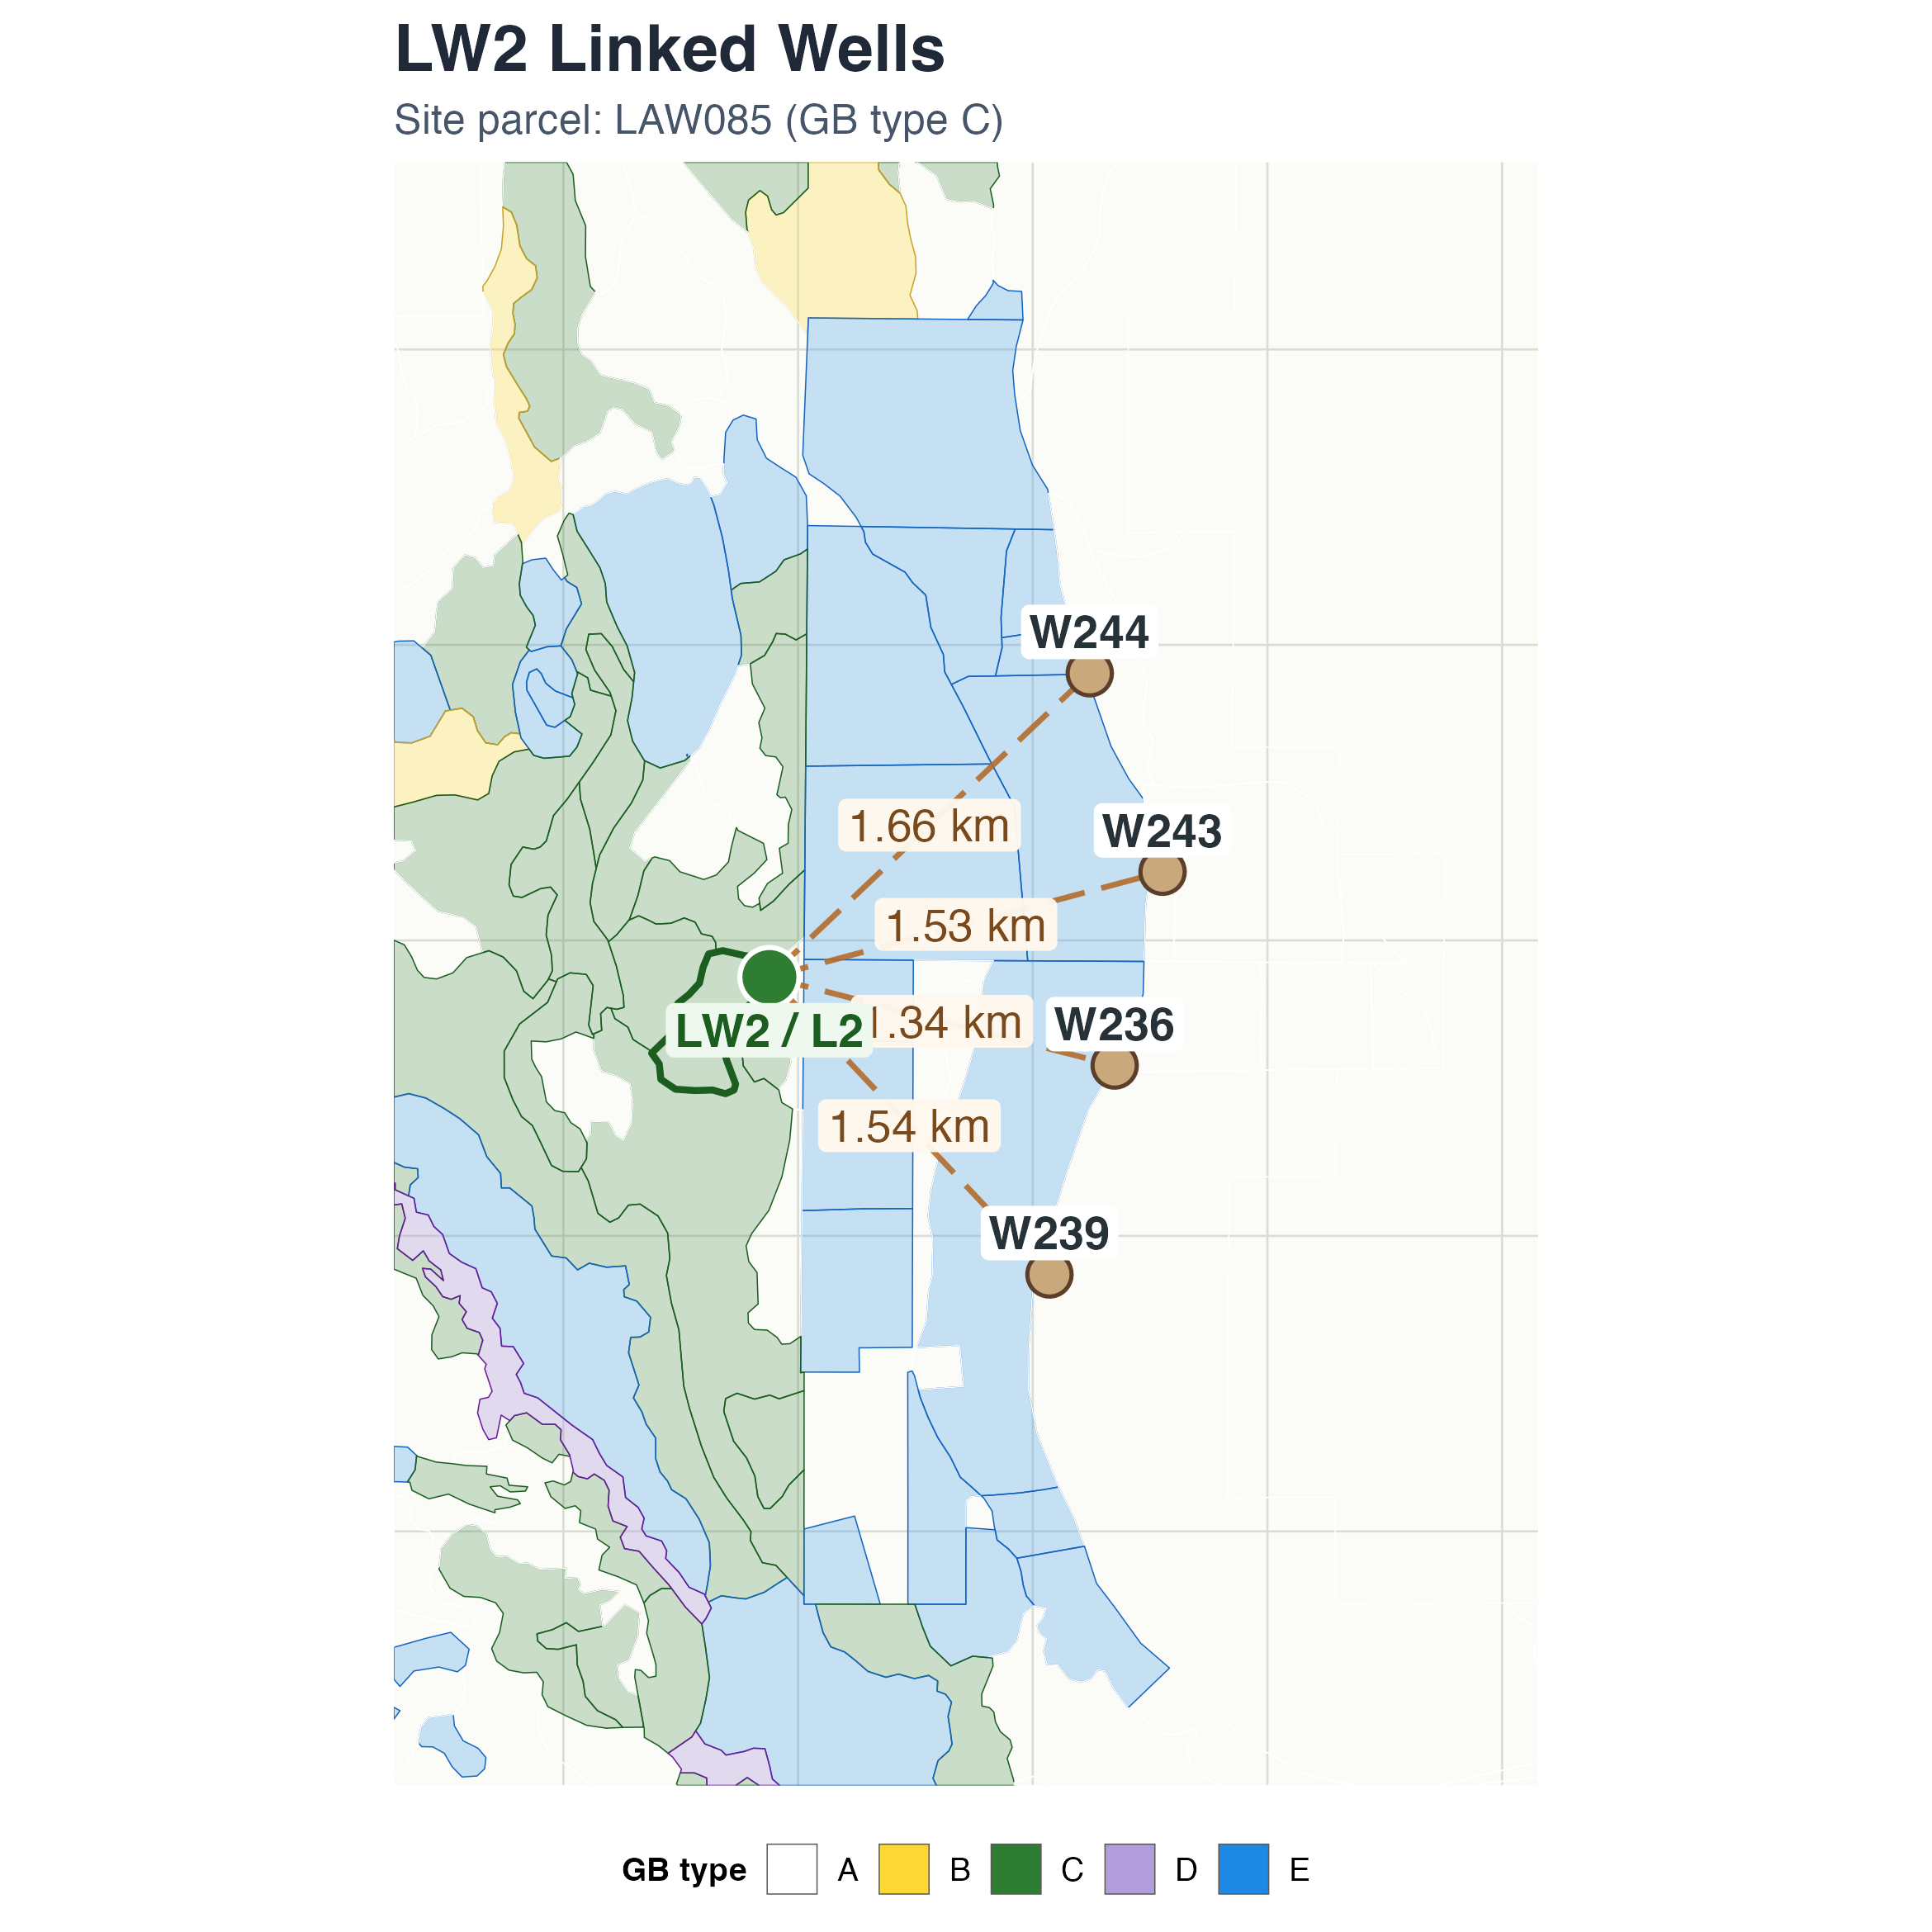
LW2
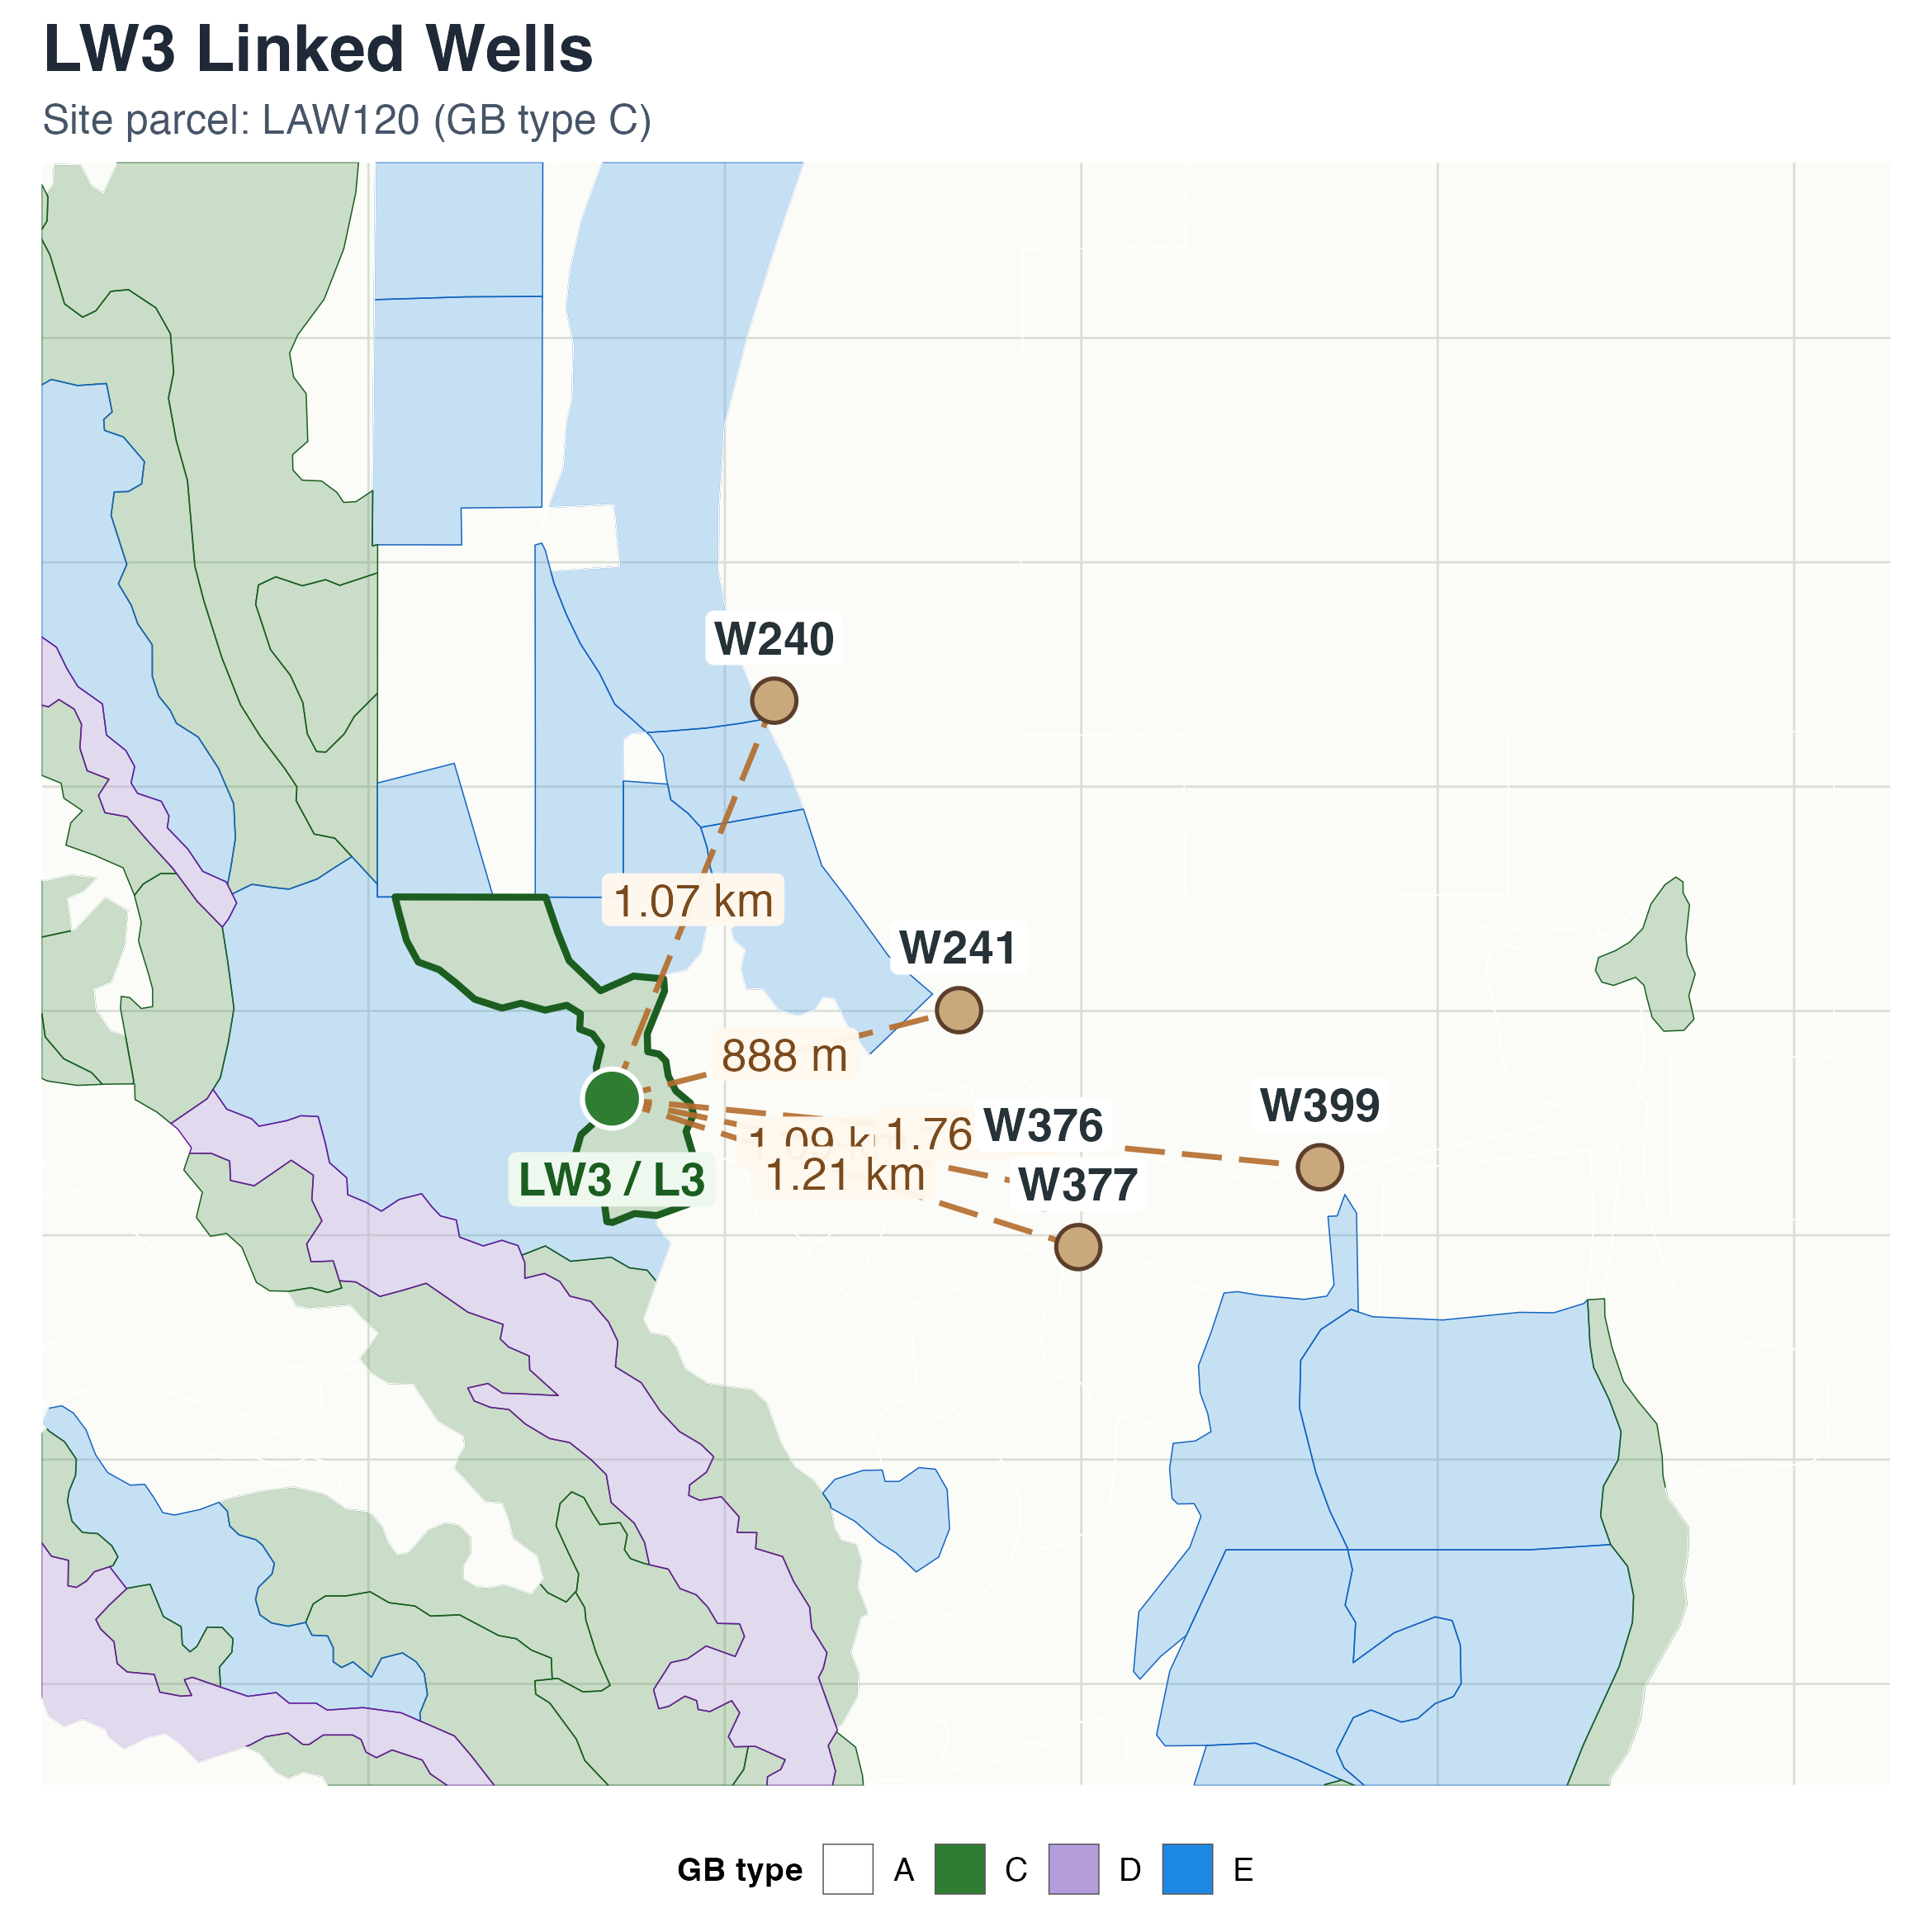
LW3
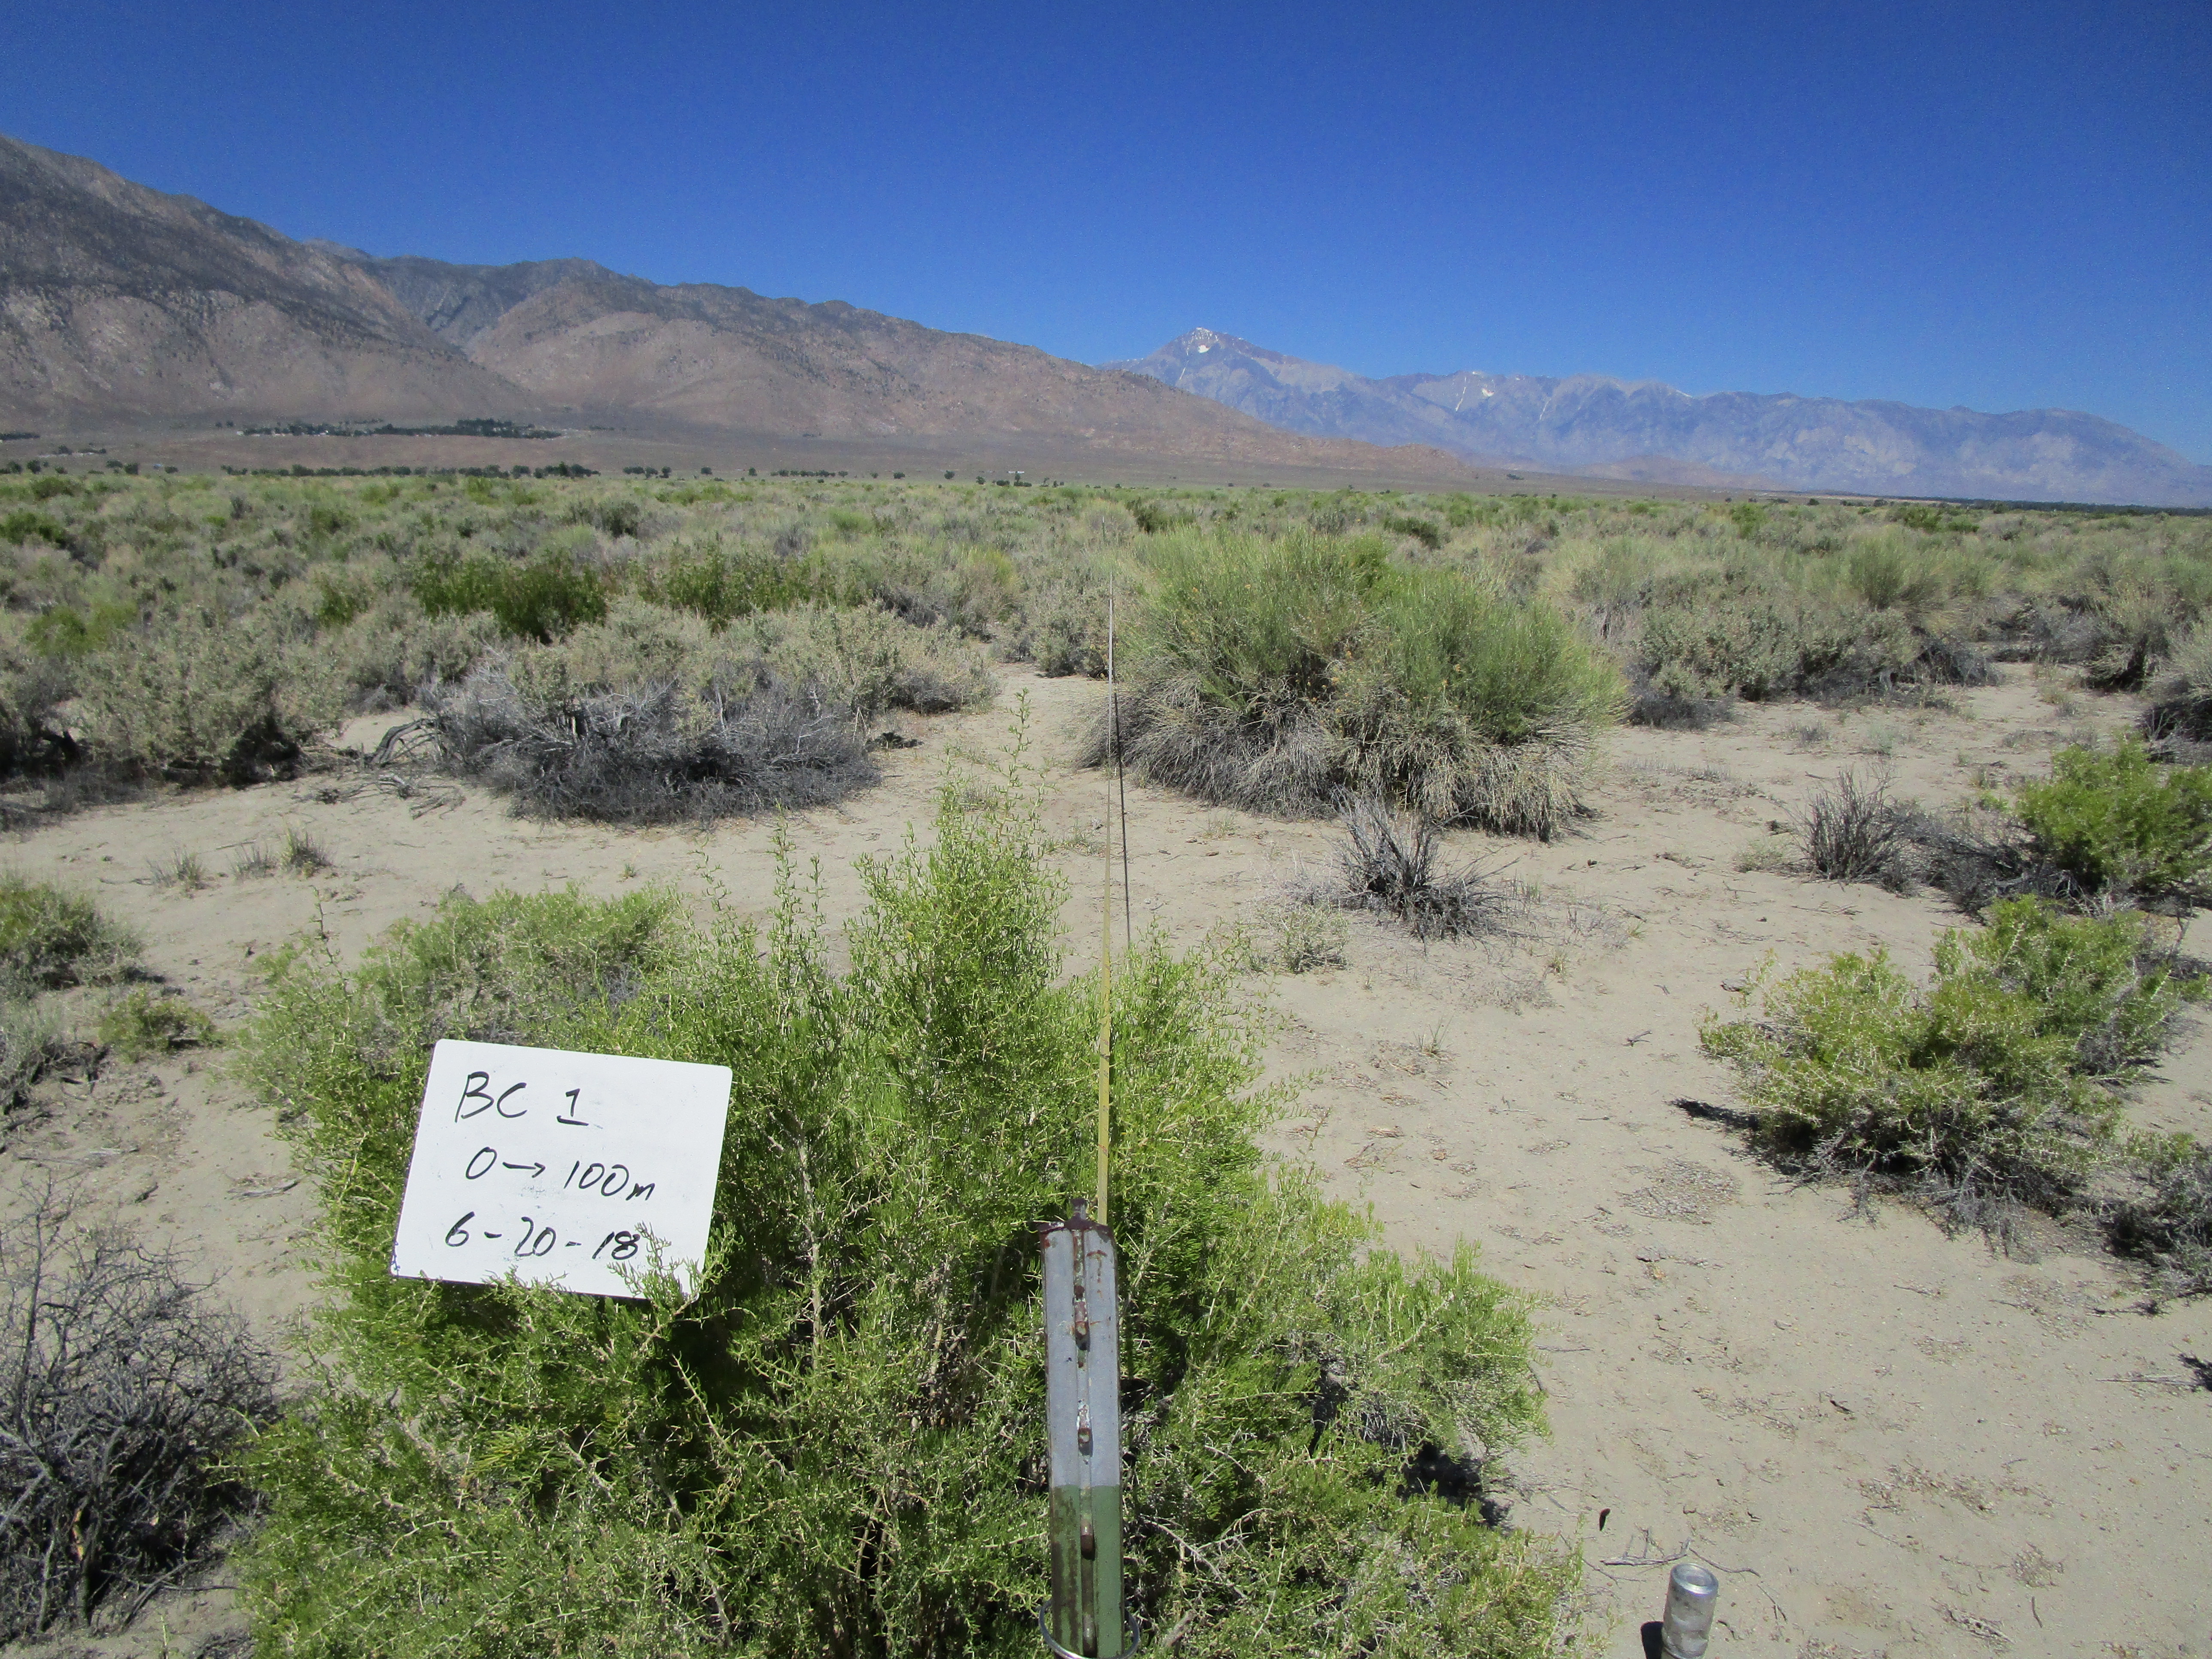
BC1
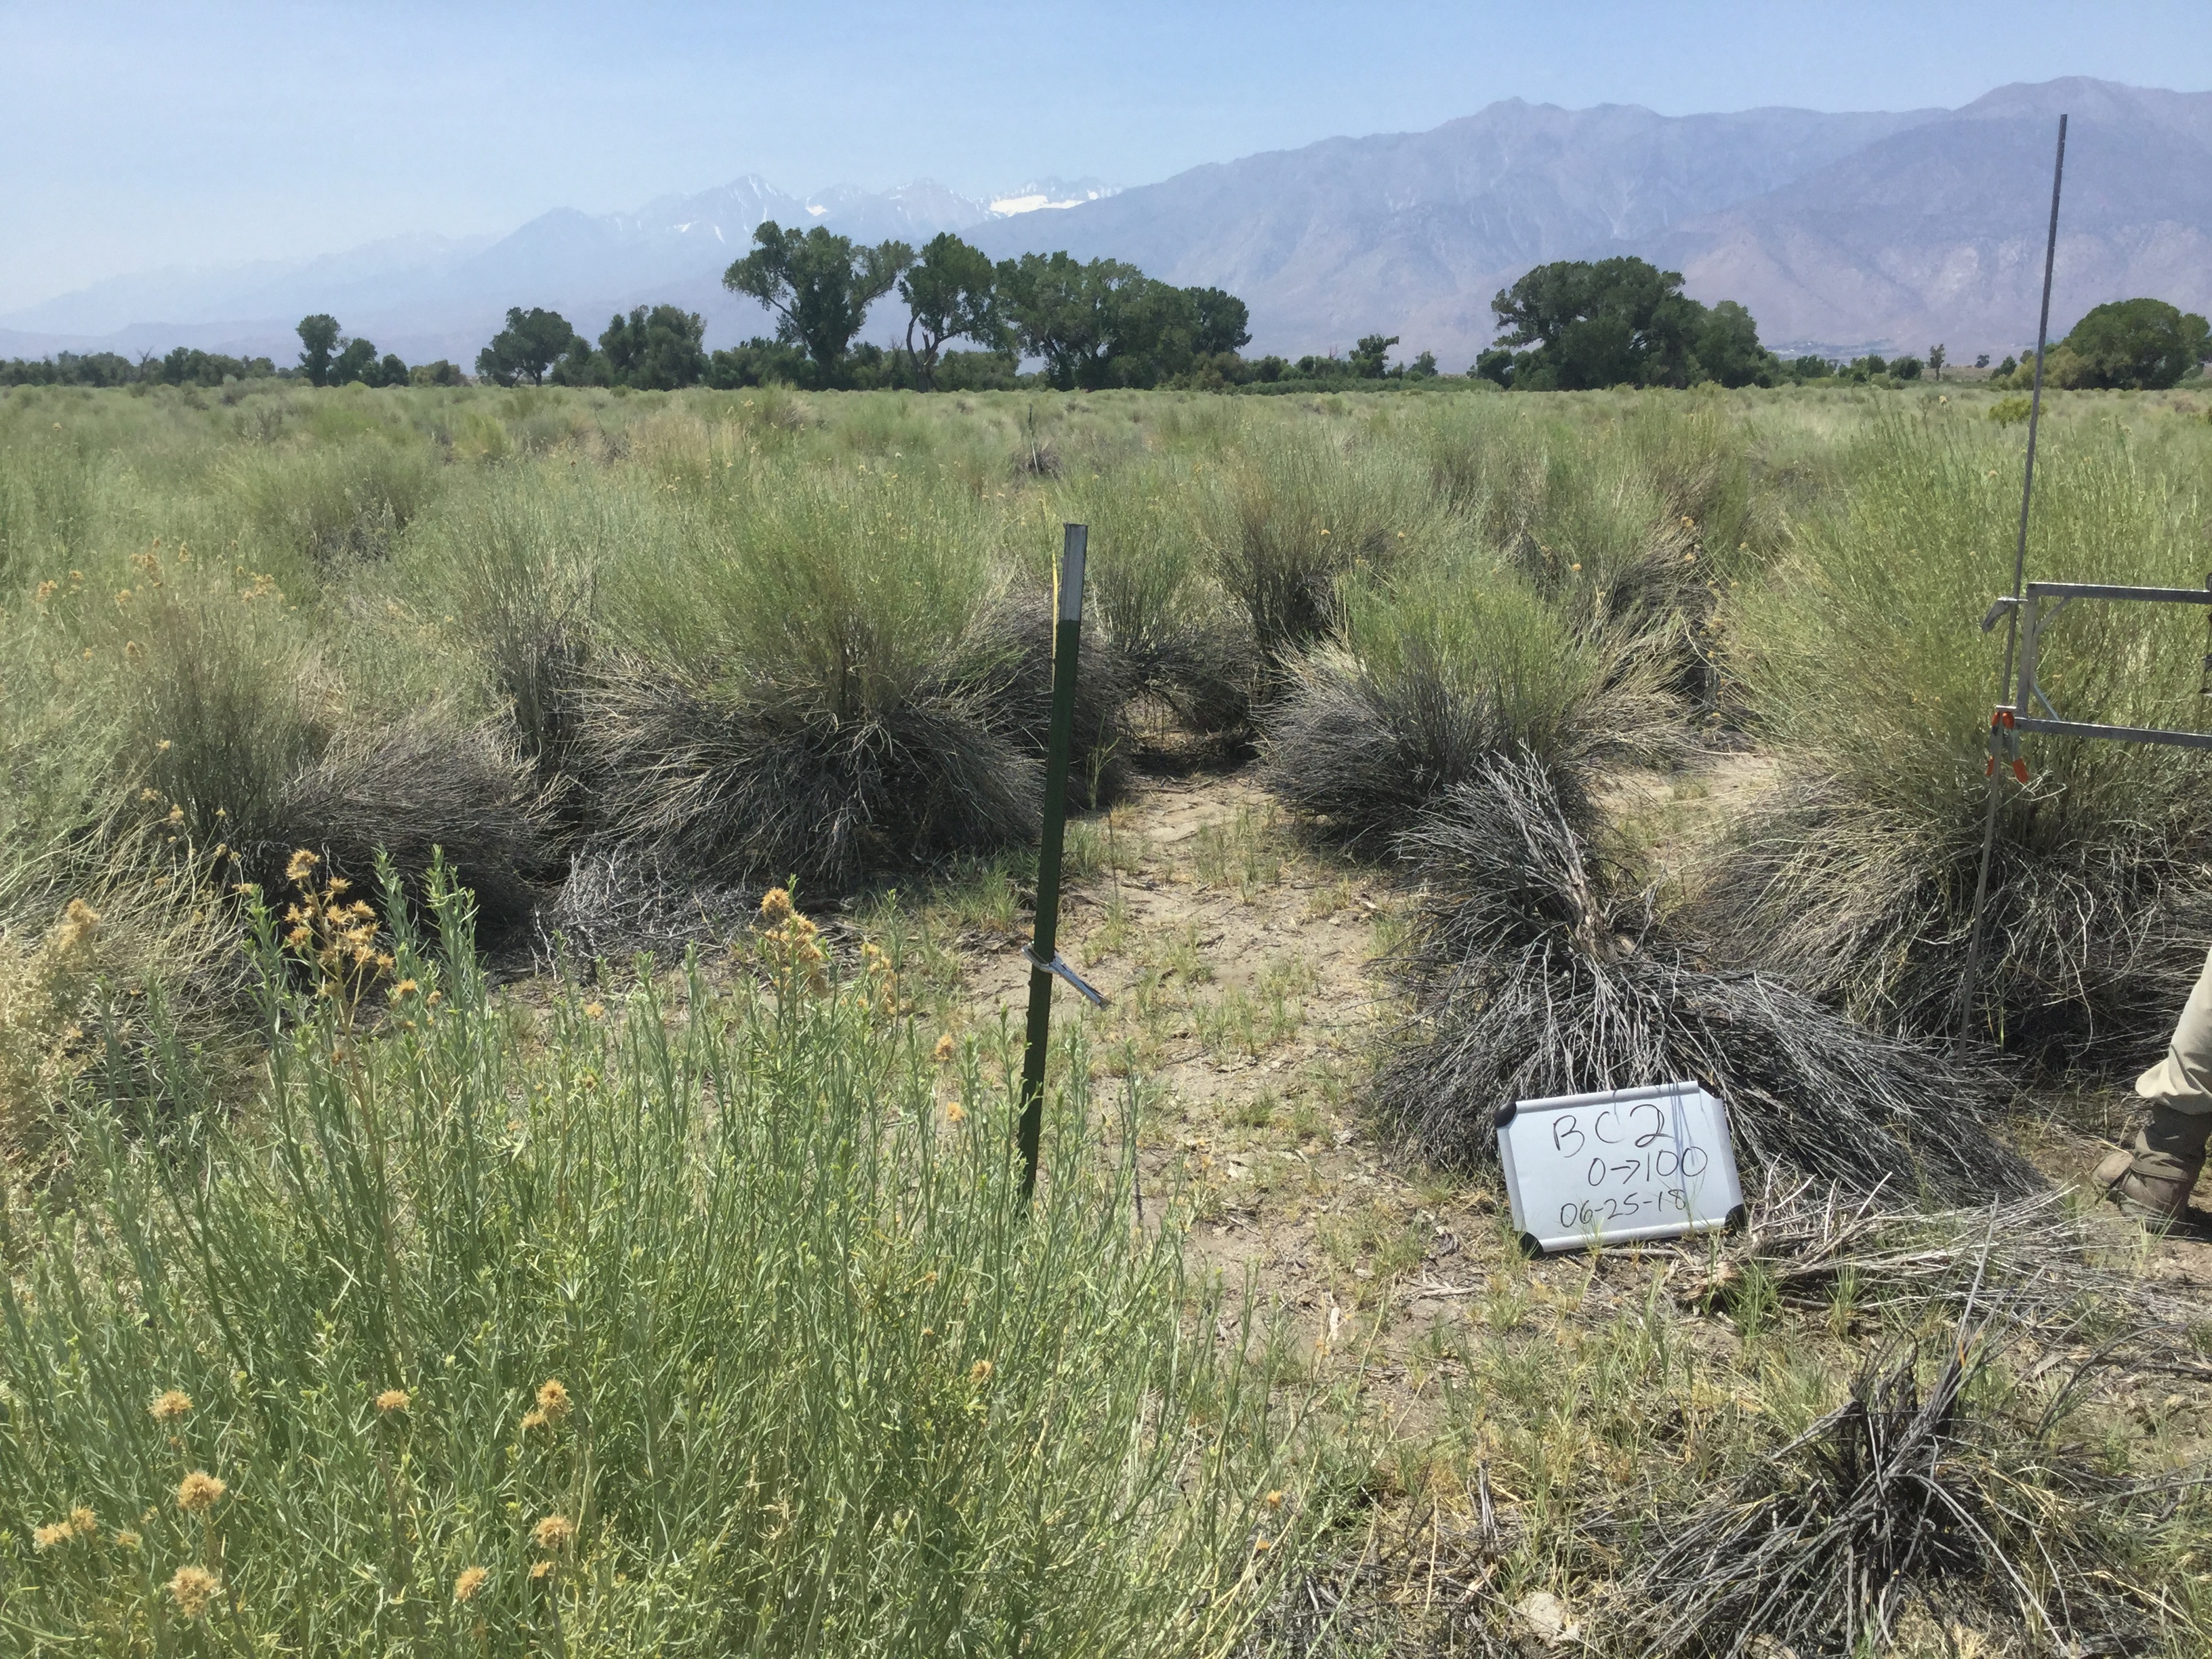
BC2
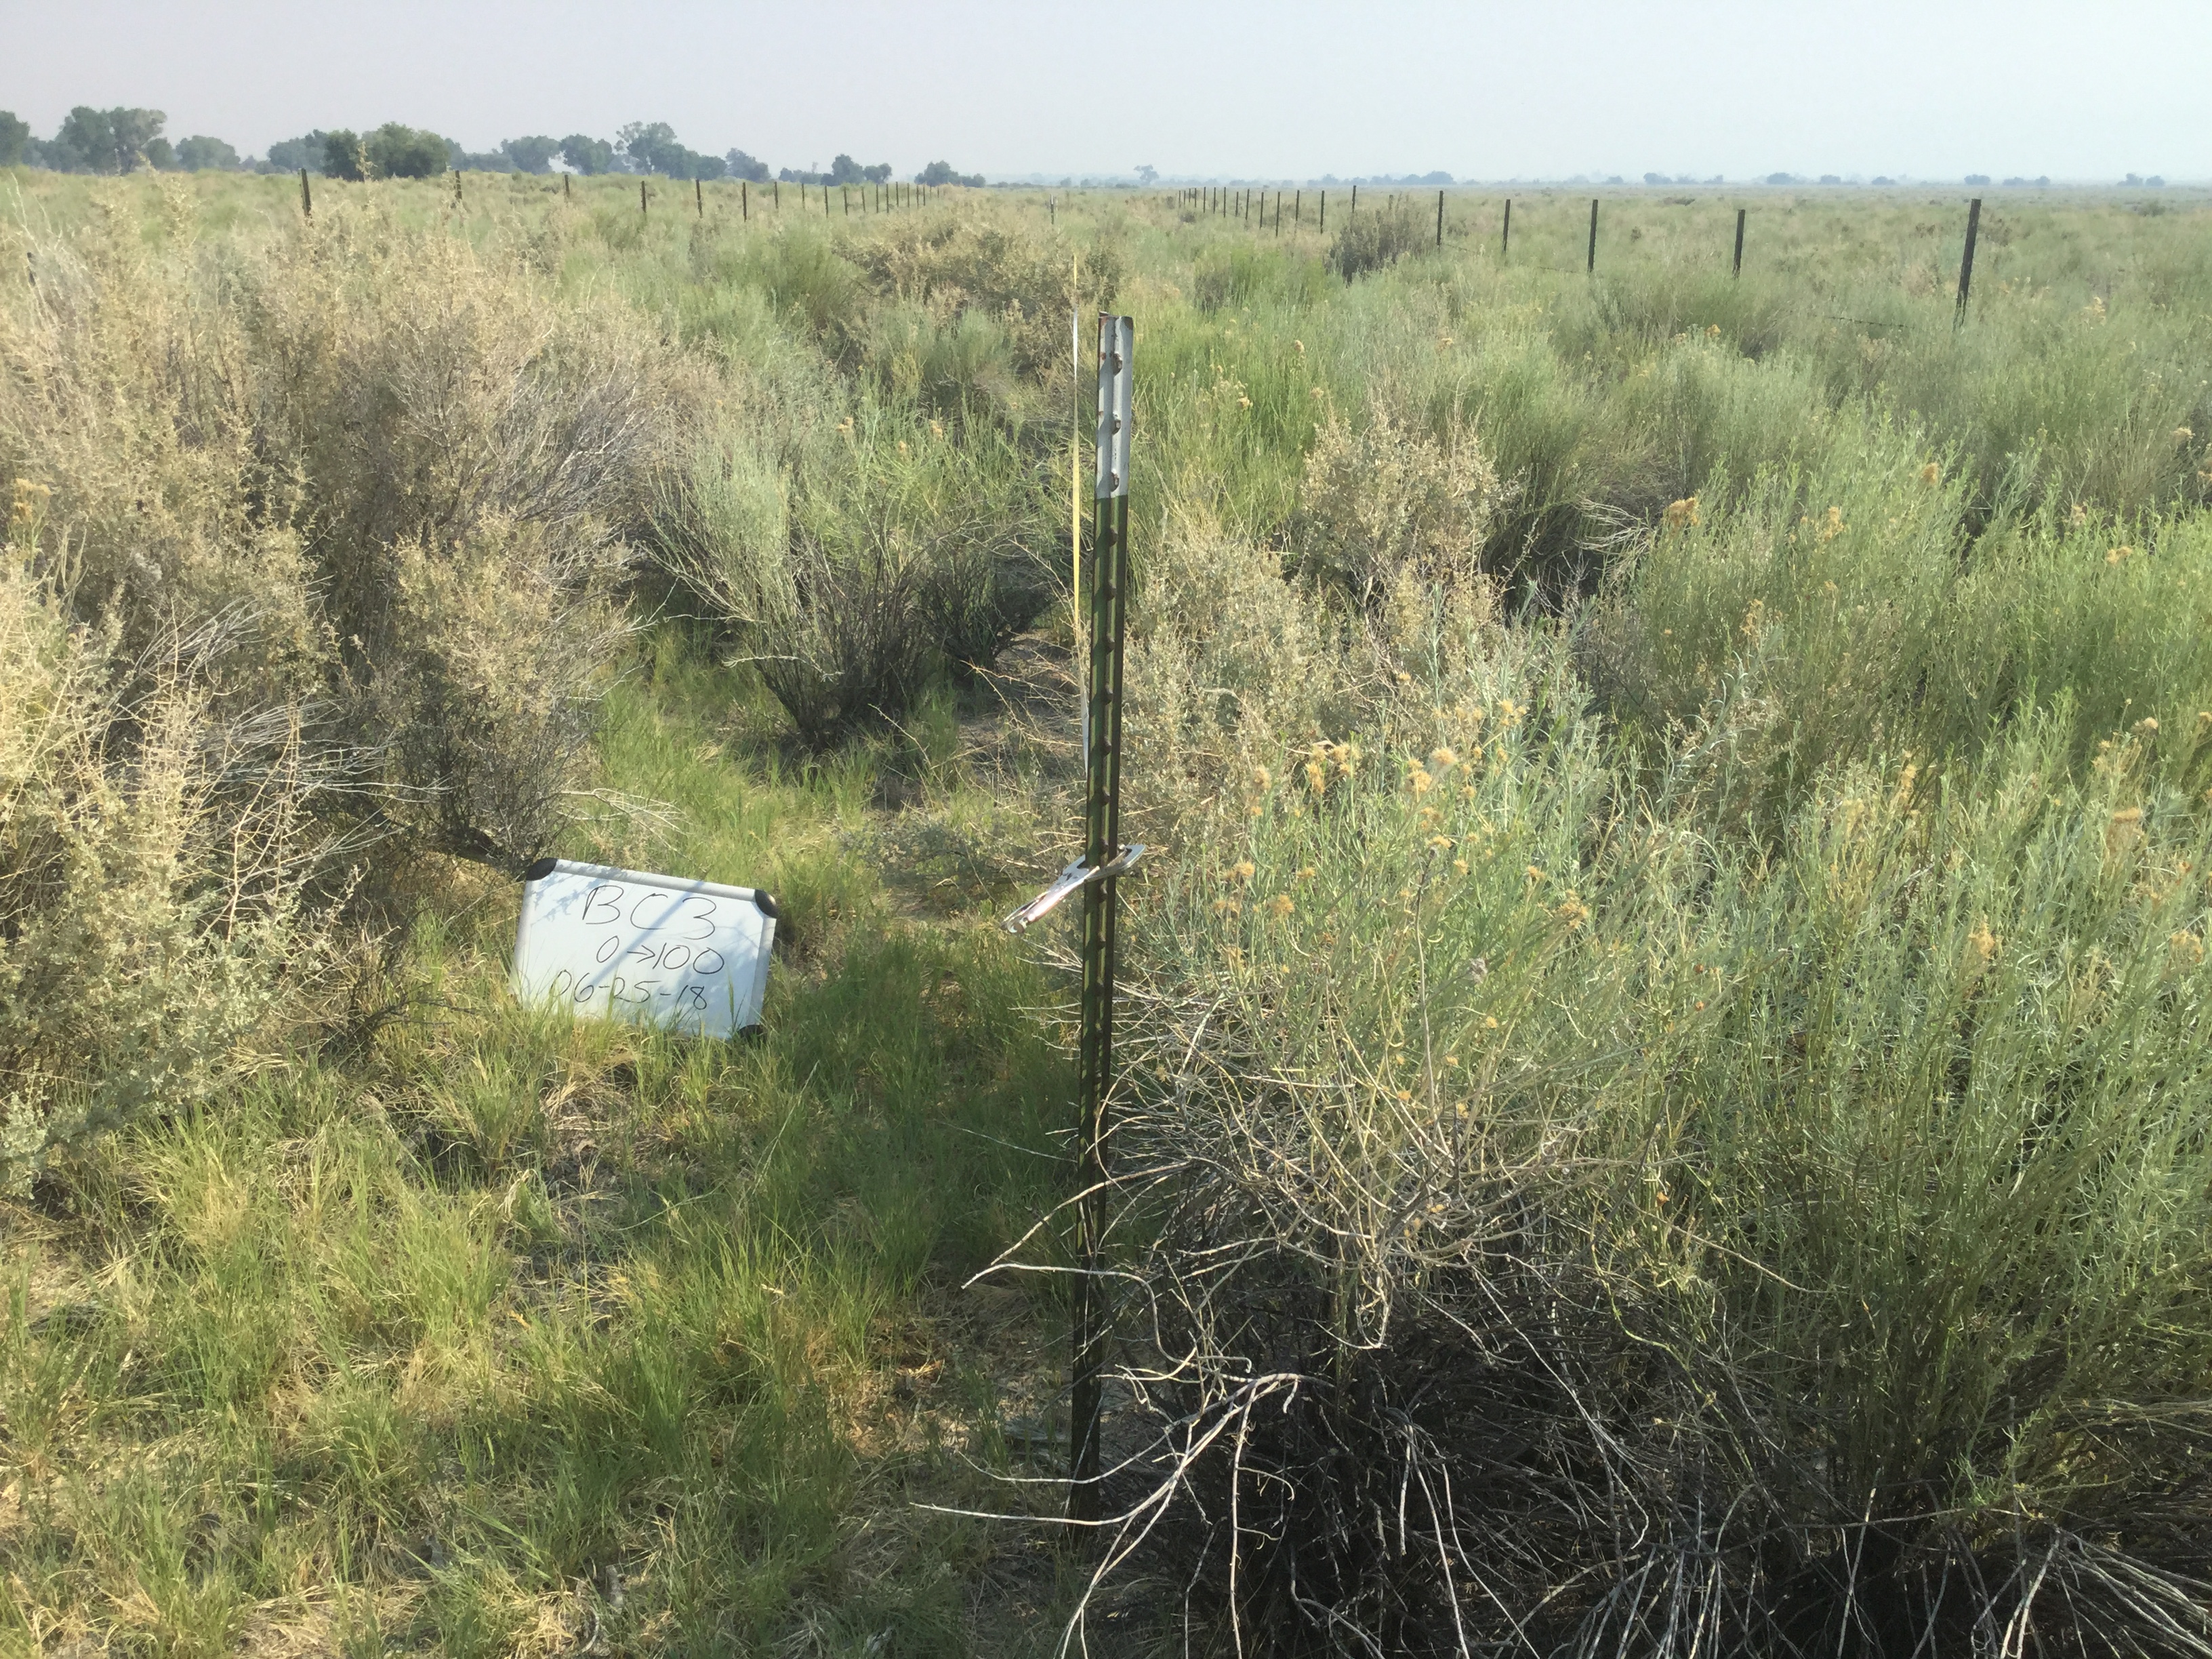
BC3
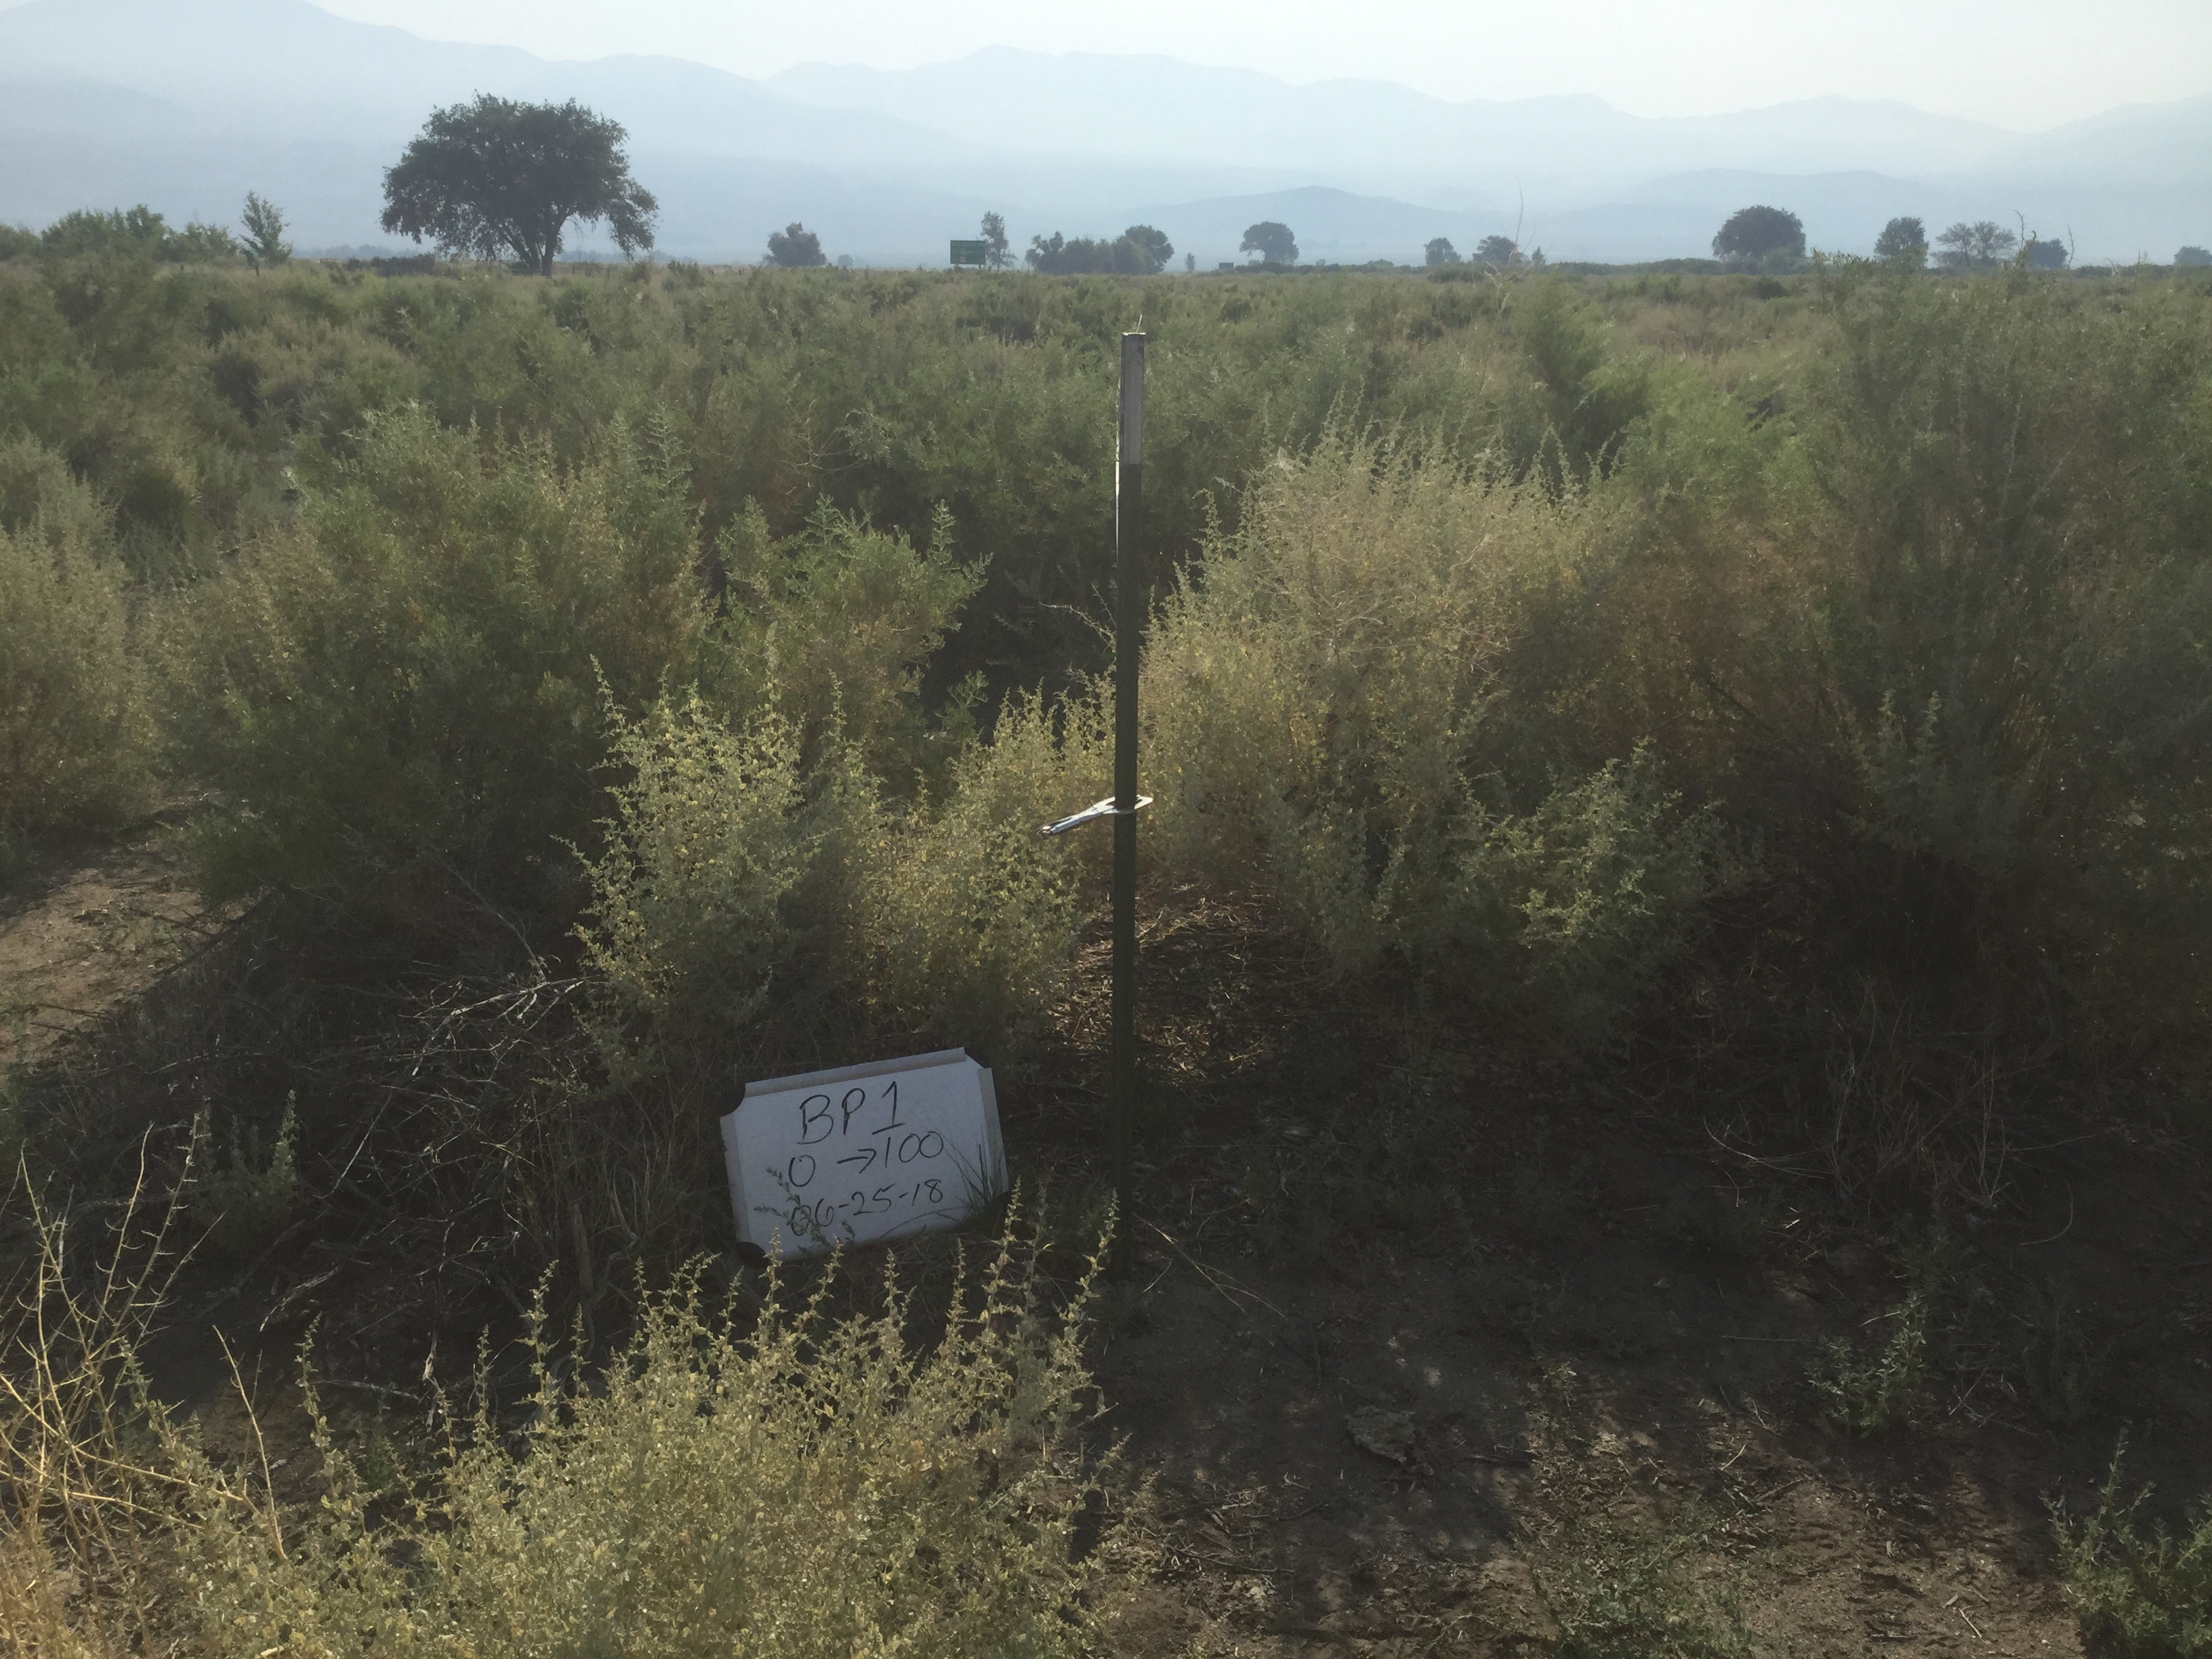
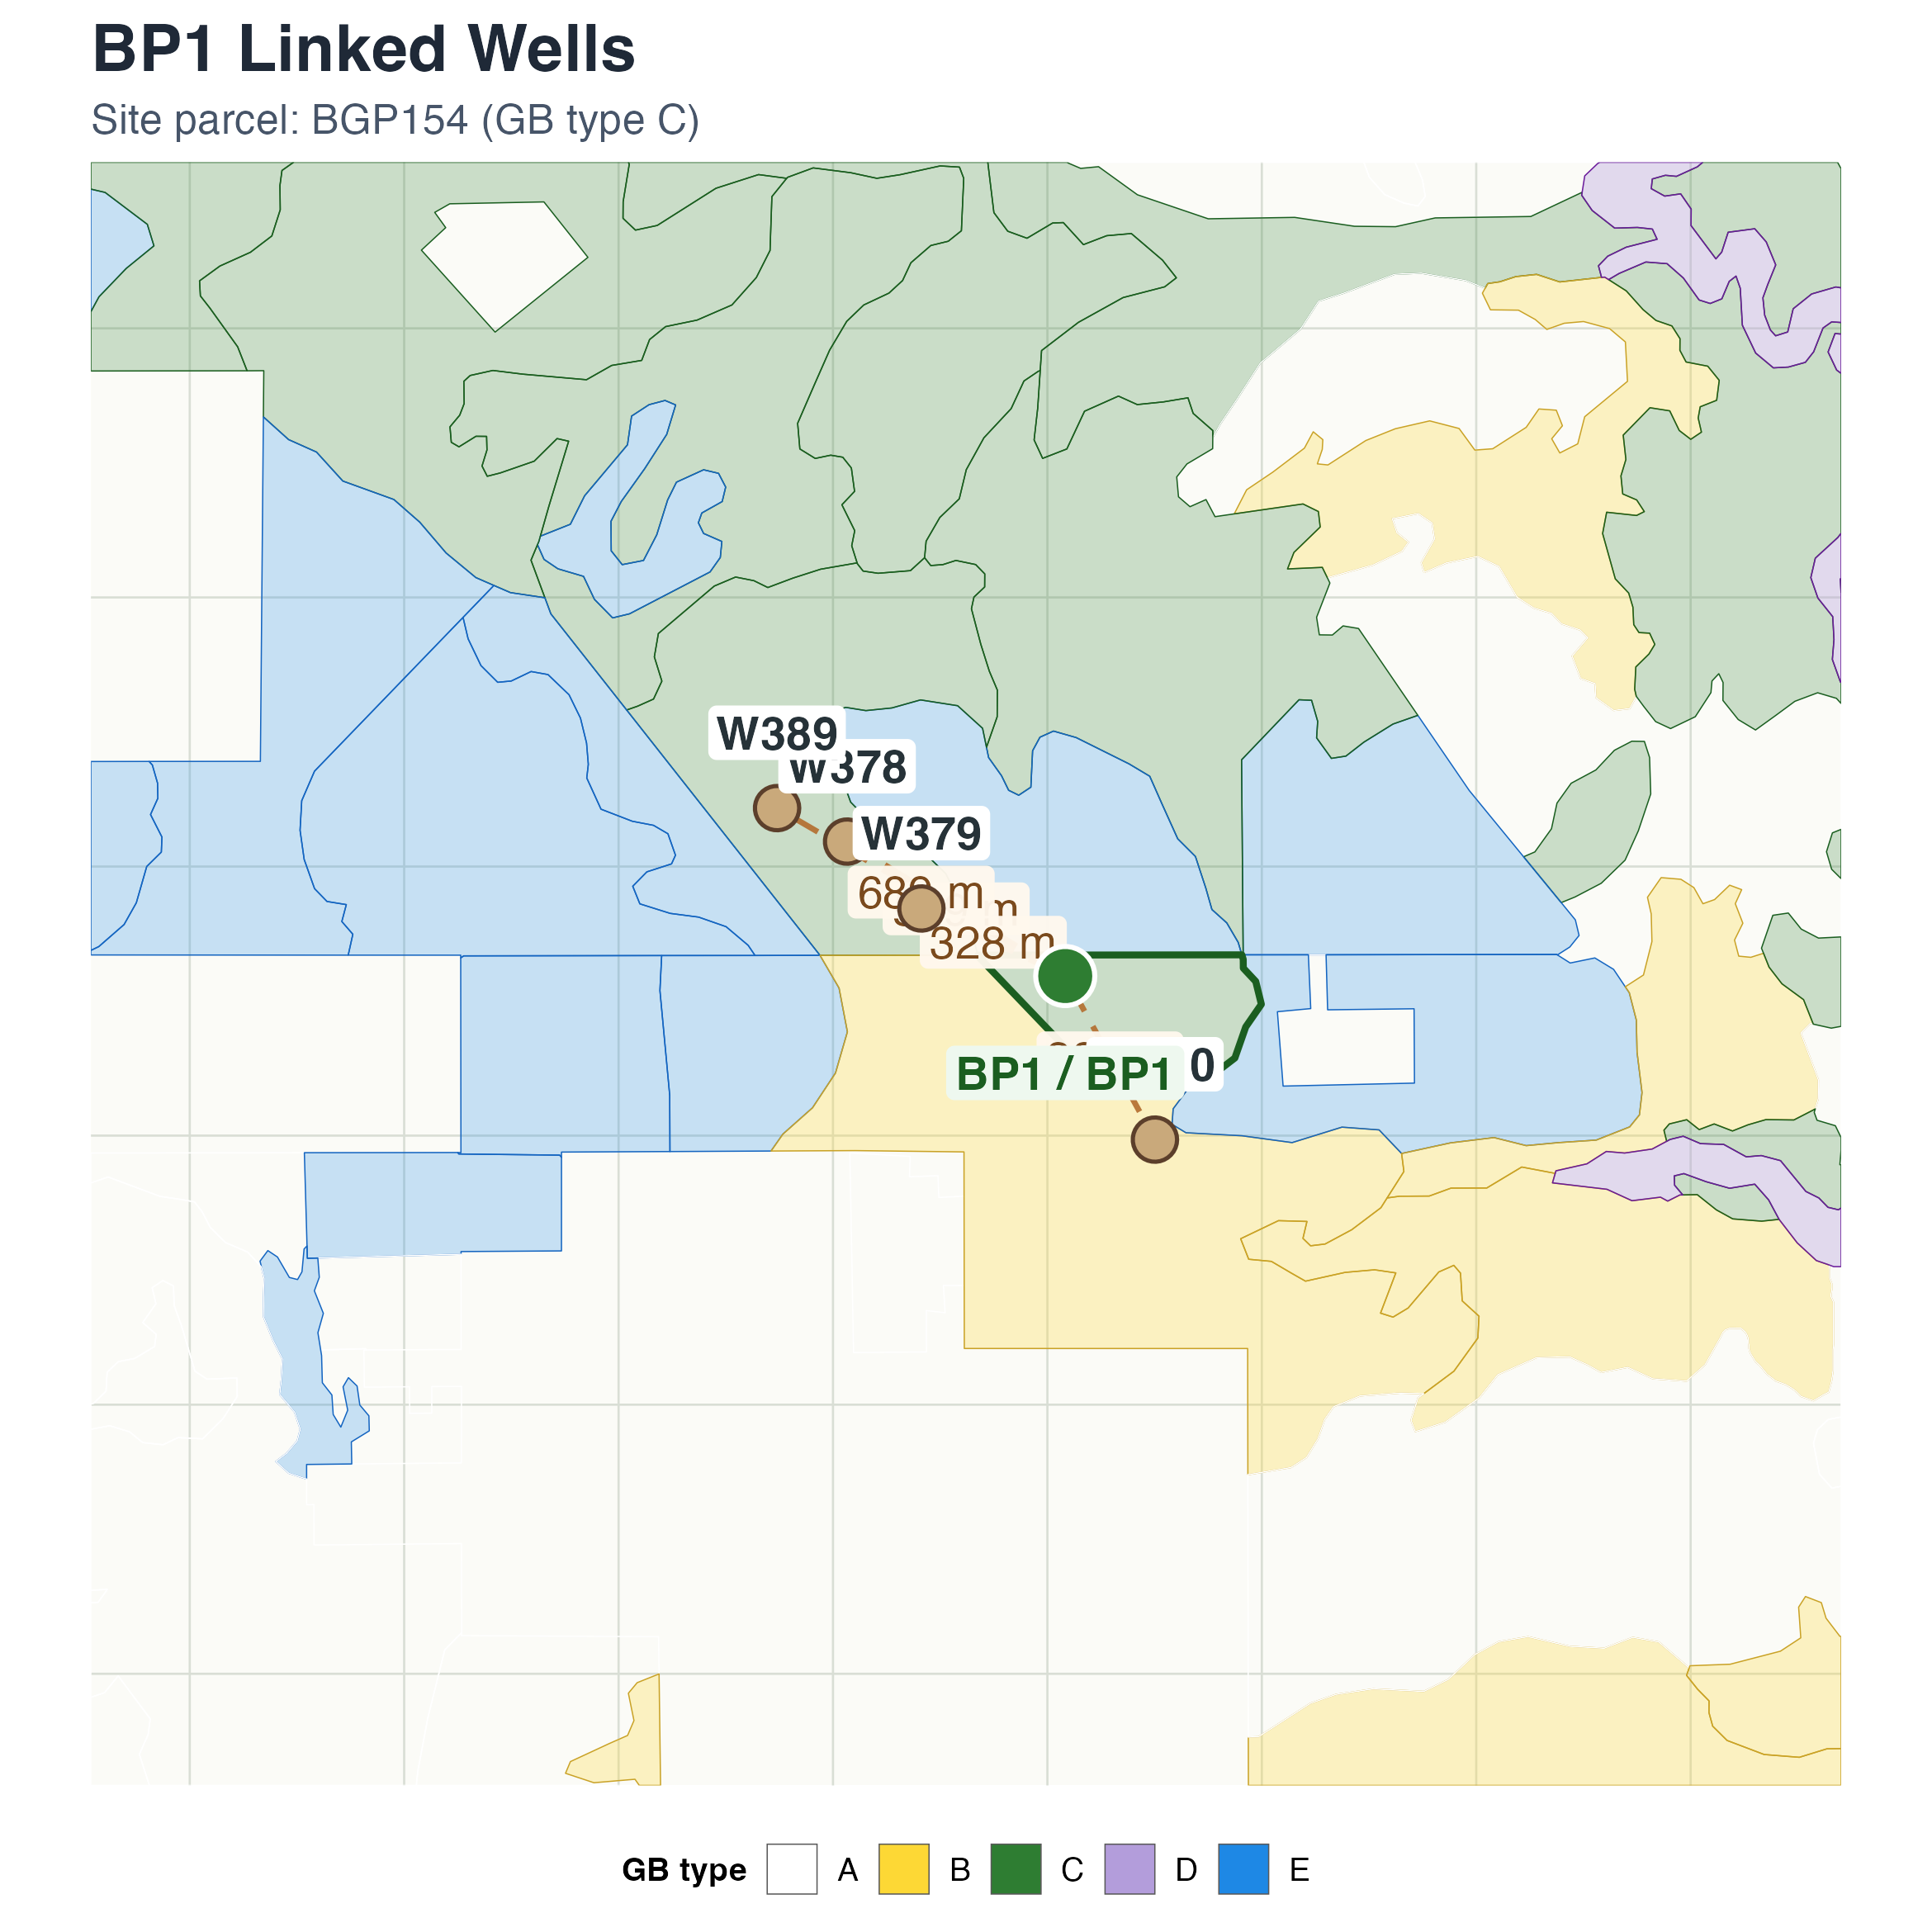
BP1
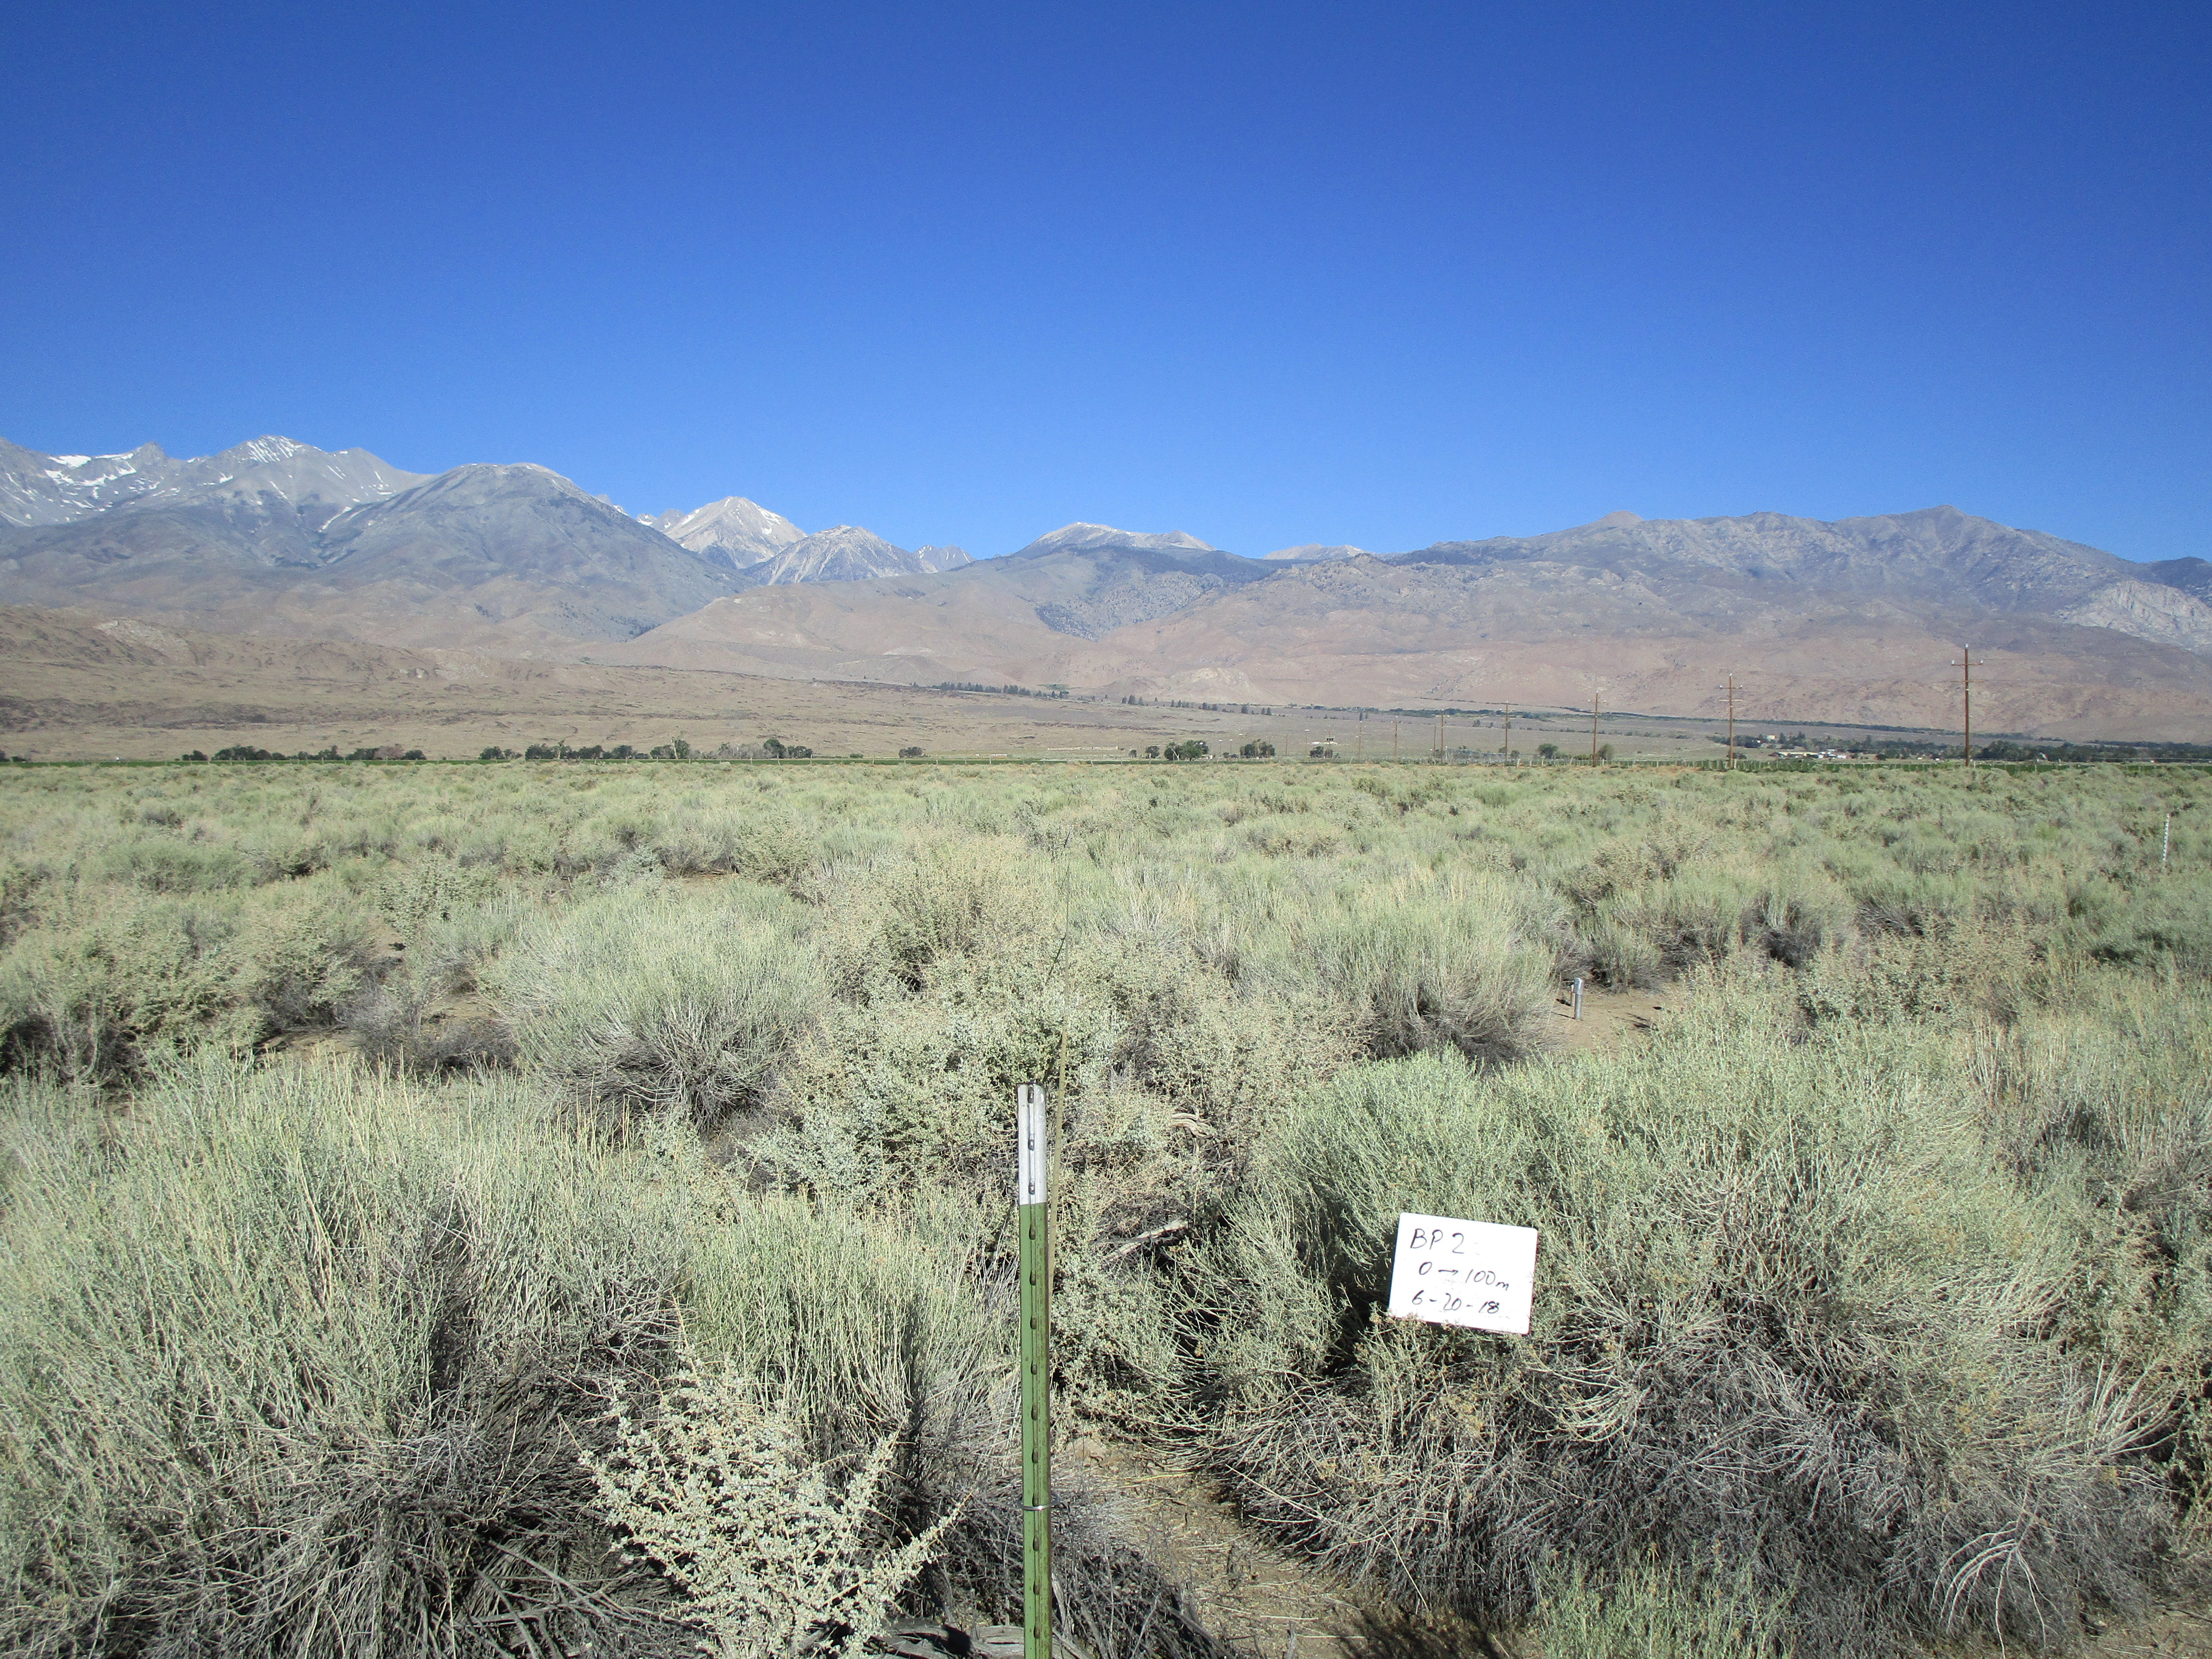
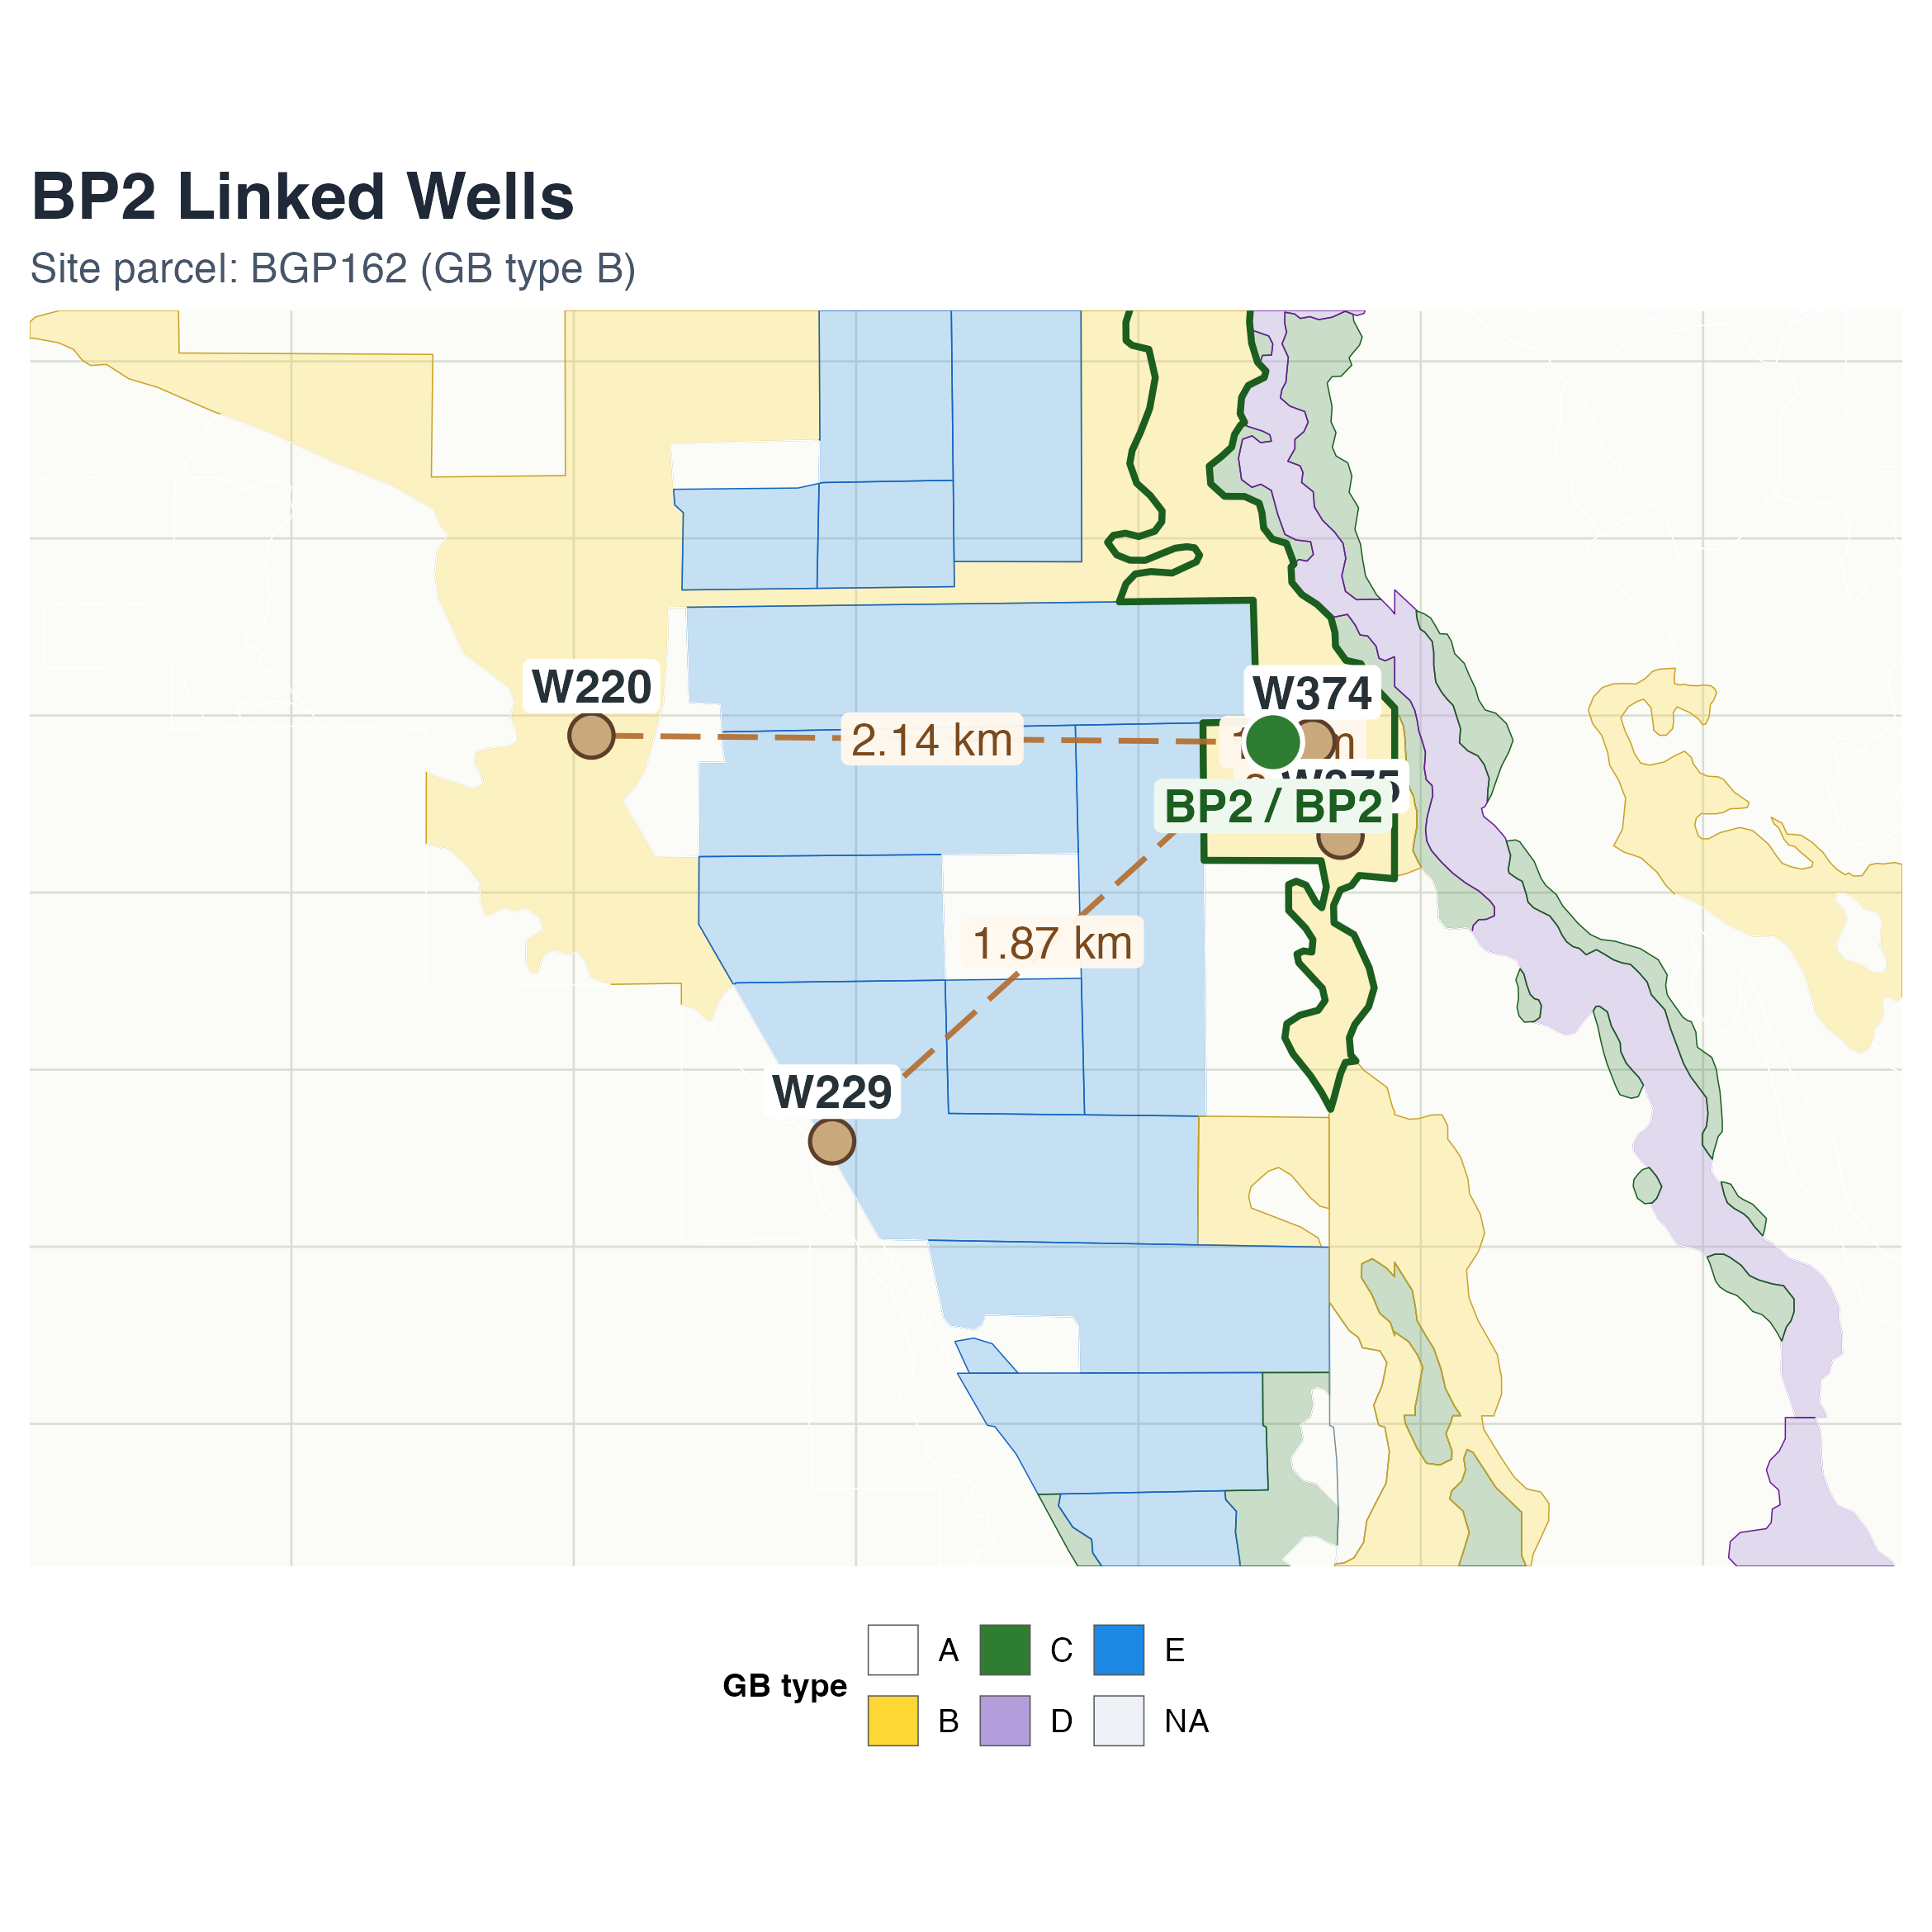
BP2
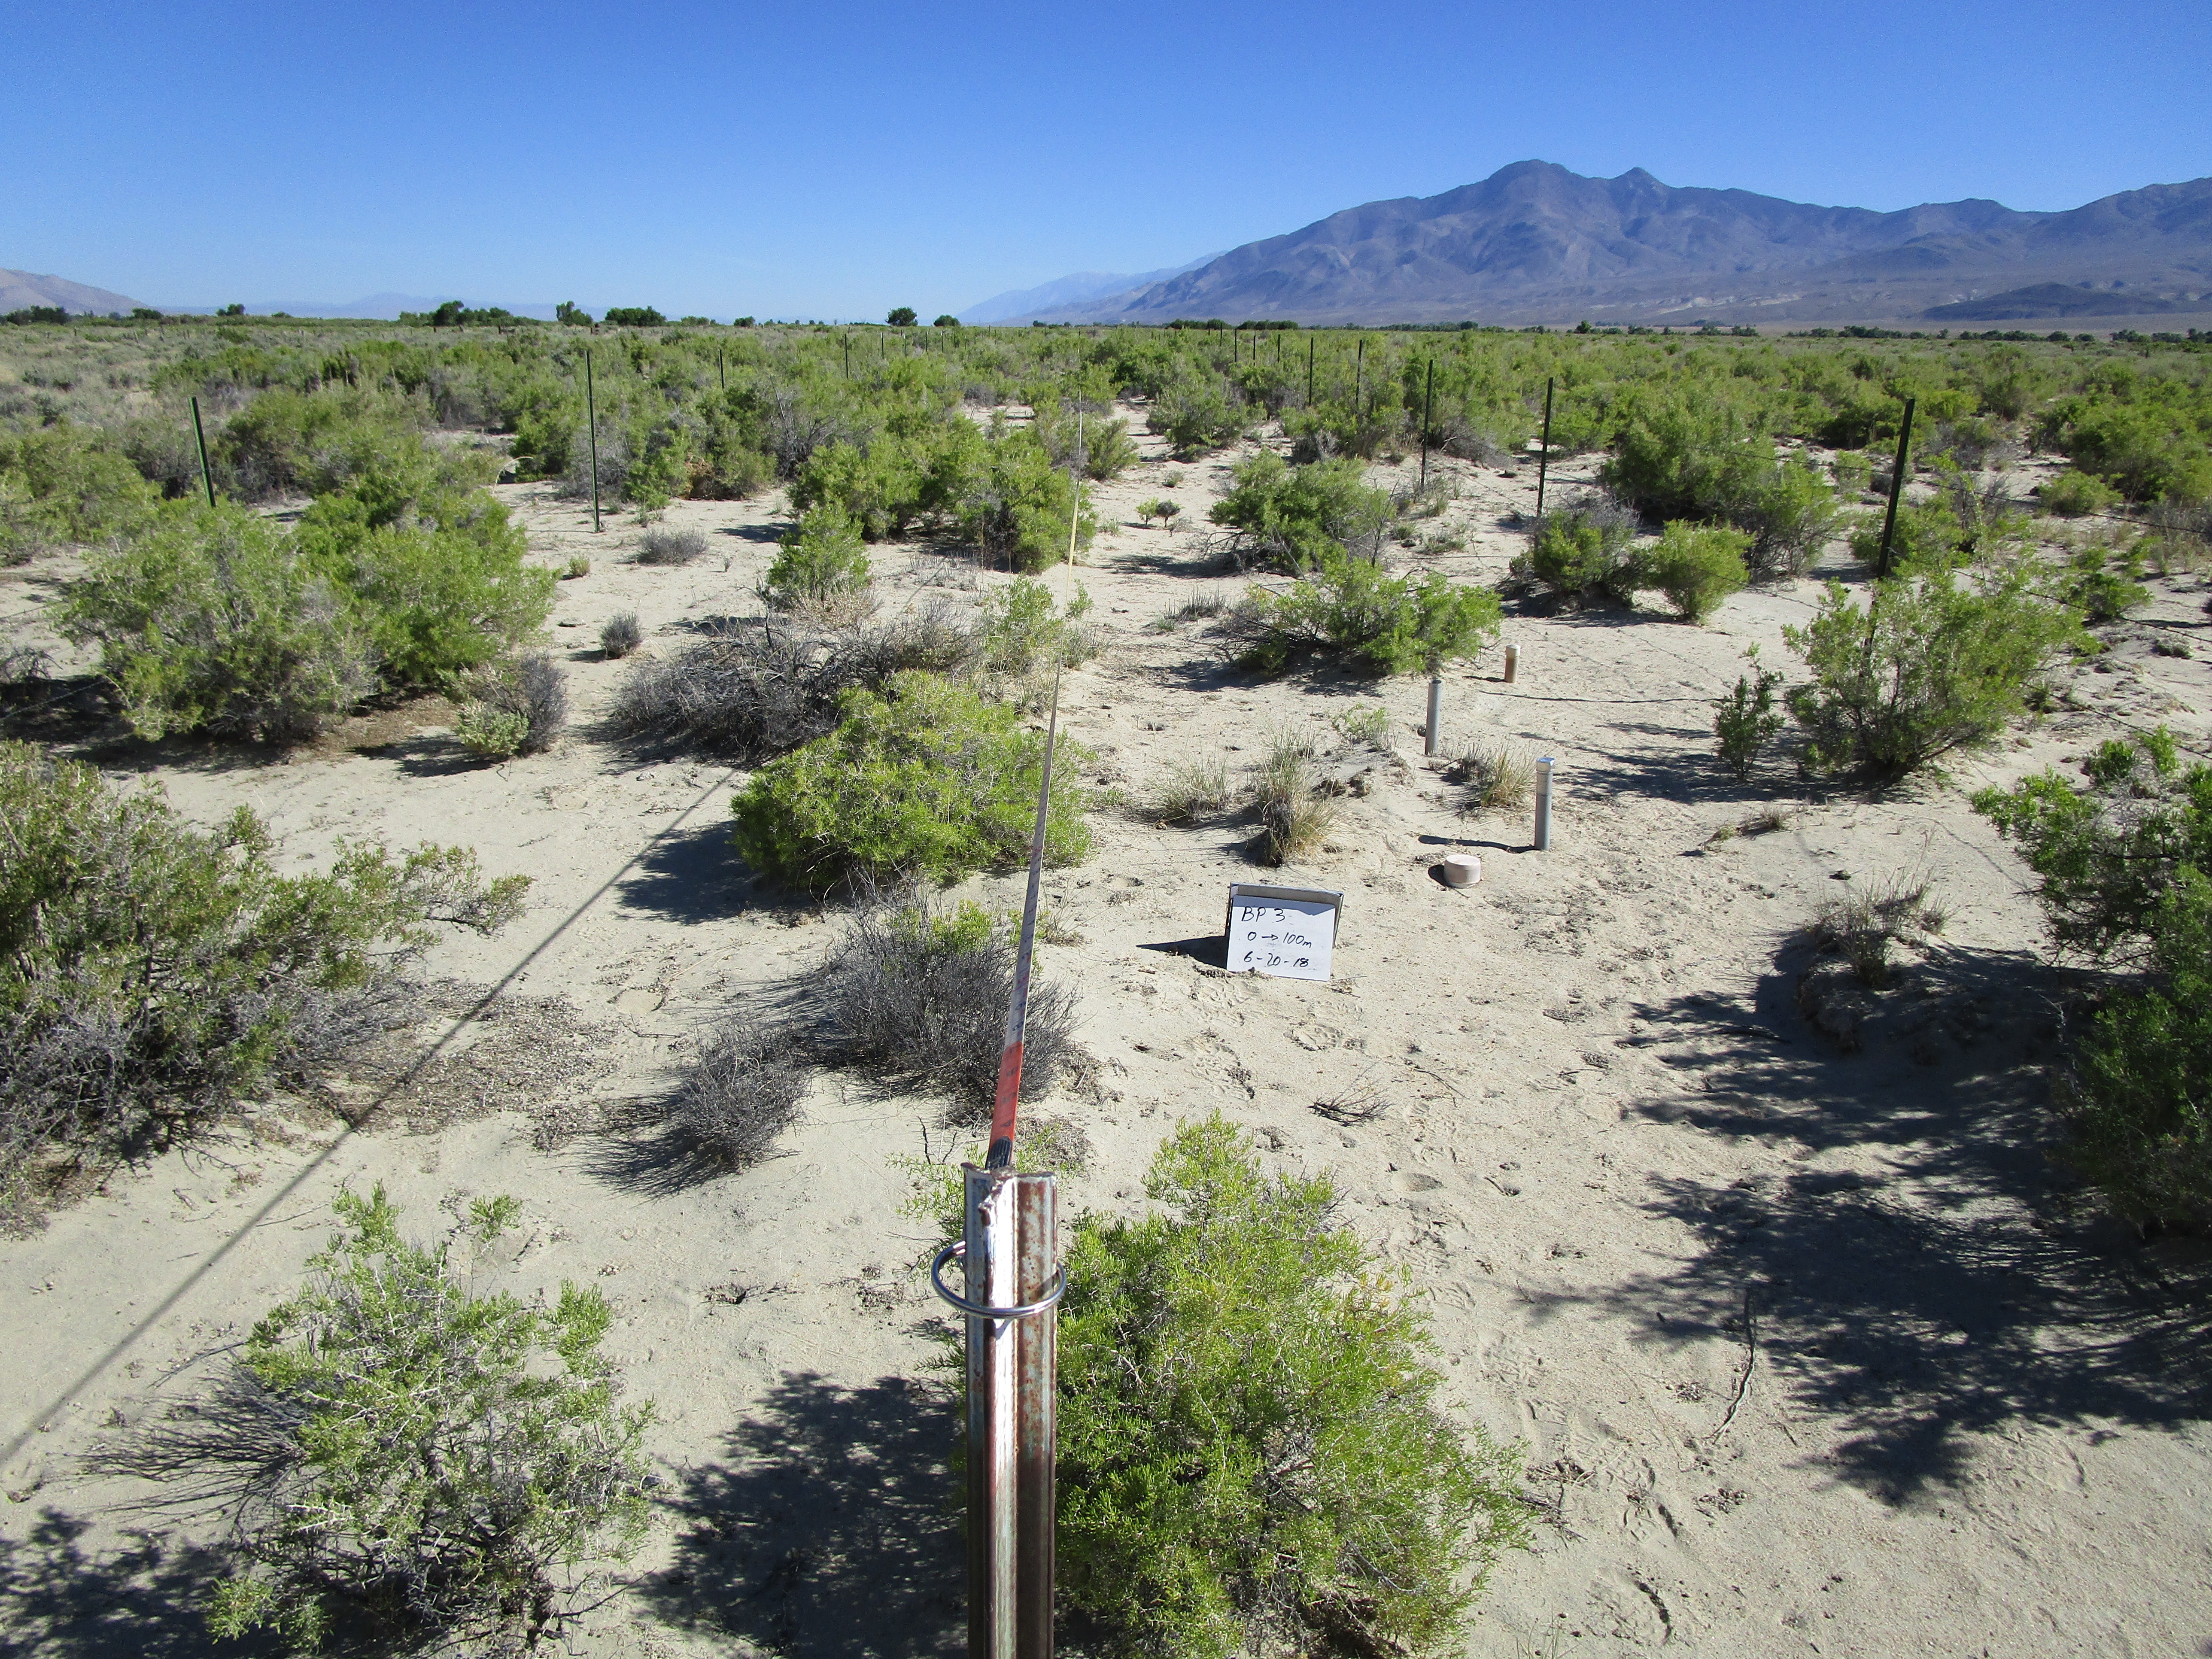
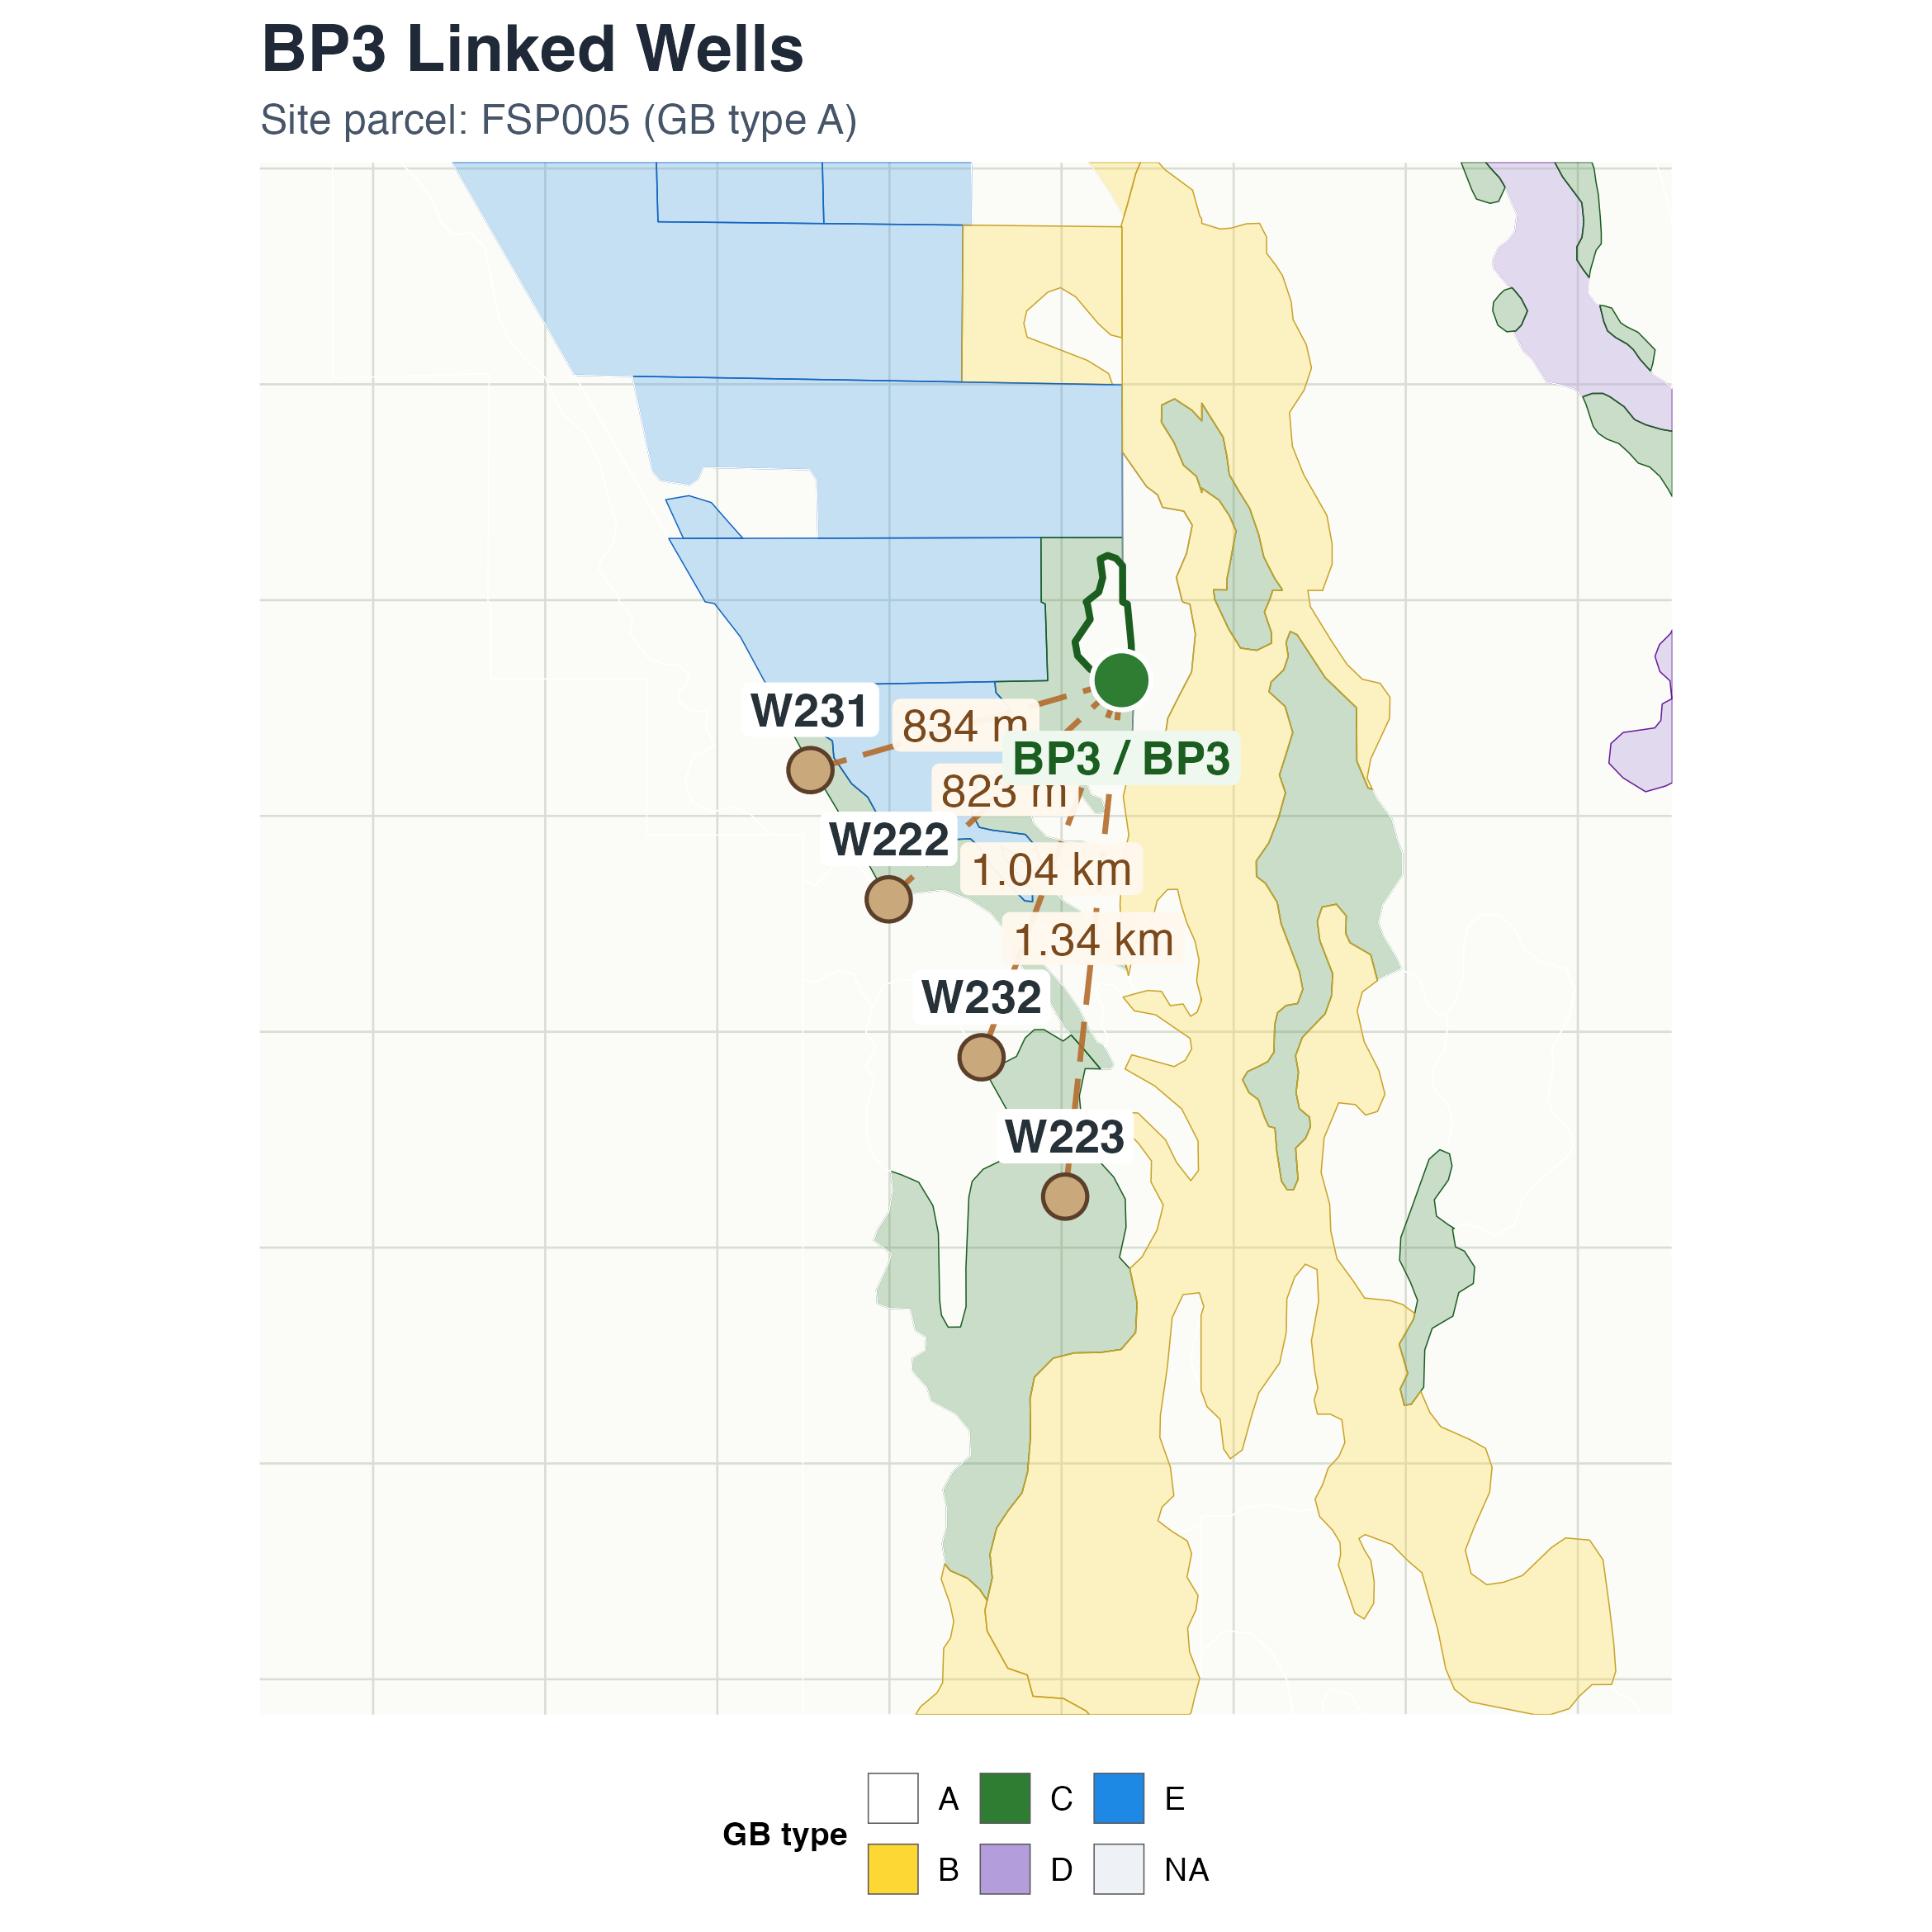
BP3
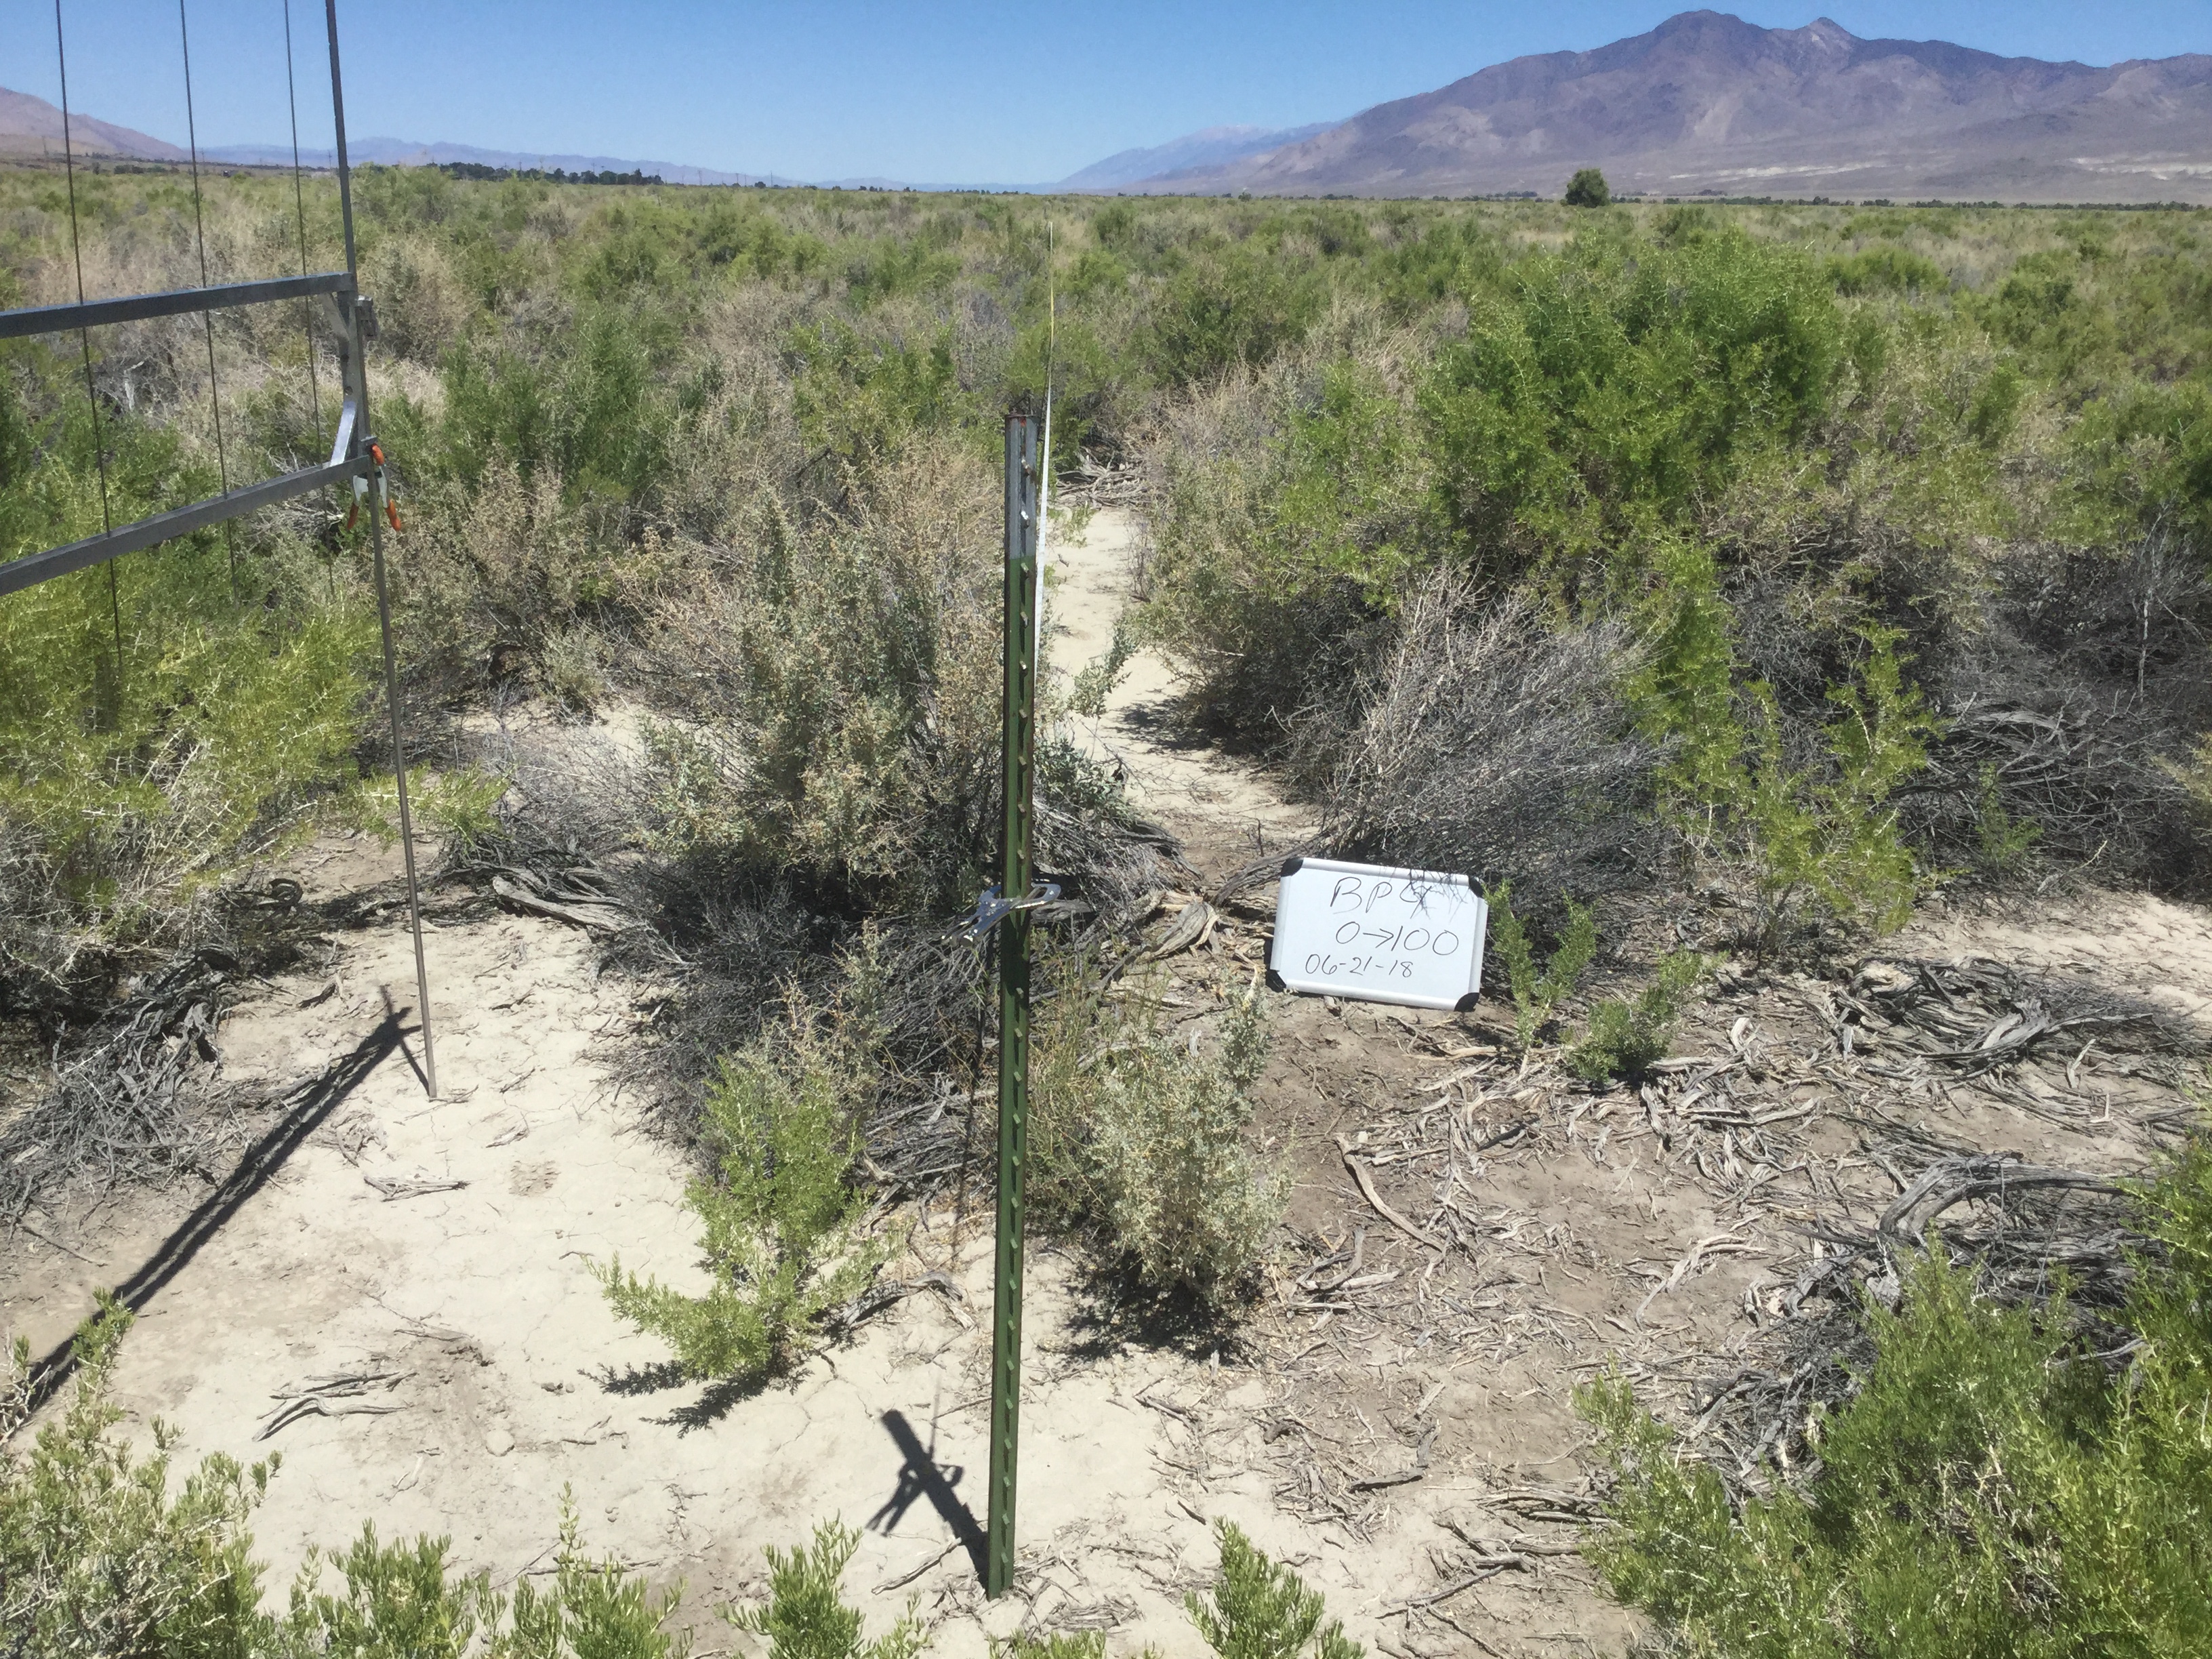
BP4
@report{2026,
  author = {},
  publisher = {Inyo County Water Department},
  title = {Soil-Plant {Water} {Balance} and {Groundwater} - {Laws,}
    {Bishop,} {Big} {Pine}},
  date = {2026-06-19},
  url = {https://github.com/inyo-gov/pumping-management},
  langid = {en}
}