Inyo County Water Department
July 25, 2026
What: 2025 line-point resurvey of 1991 EIR / 1999 Revegetation Plan mitigation parcels—cover and composition against Table 2 goals (Los Angeles Department of Water and Power 1999).
Why: Separate from Laws Type E (2003). Partners need a transparent path from segment hits → site goals. Pages marked (draft) elsewhere are prototypes; this report is the working 1999-plan monitoring product.
Parcels: IND105, IND123, IND131N/S, BLK16E, TIN054, BGP160E/W, BIS097, and LAW118 (1999-plan context)—not the Type E transfer dashboard (Laws / reference).
Cover math: We use species hit counts only from the 2025 workbook; staff %COV / %COMP columns are ignored. Percent cover = hits / n_possible_hits × 100, with n_possible_hits = segment length (m) / 0.5.1
What the Plan requires (Los Angeles Department of Water and Power 1999): site-specific live native perennial cover, composition (species contributing to cover), and recruitment / sustainability (≥25% of vegetation cover as natural recruits ≥3 years old).
What this report scores: cover and composition from 2025 LPI (with the master-workbook CI rules below). Sustainability is not scored from LPI alone here; the LADWP aerial pilot is summarized next as context for that third criterion.
Goals below follow Table 2 (2021–22 Mitigation Projects and Status).
What: A remote-sensing workflow (high-res imagery + LiDAR → live/dead/bare → interannual overlap) to estimate recruit share of live cover on IND105.
Why summarize it here: The Plan’s 25% recruit rule needs an operational definition; this pilot is the current LA proposal. Full deck remains local (reveg1999plan-docs/); County dual-track notes in docs/1999plan_sustainability_monitoring_proposal.md.
Why IND105: cover and composition already met—useful for testing sustainability; IND123 is also of interest for full completion.
What: (R) = (recruit live area) / (total live vegetation cover), compared to Plan ≥25% of vegetation cover—not parcel area (Los Angeles Department of Water and Power 1999).
| Epoch | Live cover | Recruit cover | Recruit % of cover | vs 25% |
|---|---|---|---|---|
| 2014 vs 2009 | 14.0% | 1.93% | 13.7% | below |
| 2017 vs 2014 (unadjusted) | 38.9% | 17.0% | 43.8% | above |
| 2017 adjusted (×0.74 + persist to 2022) | 28.9% | 14.4% | 49.7% | above |
| 2022 vs 2017 | 11.1% | 1.27% | 11.5% | below |
Annual issue (slide 13): 2017 RS cannot separate annuals; IND106 T10/T12 (within IND105) had 25.7% annual hits → scale cover × 0.743; keep non-intersecting polygons that overlap 2022 live or dead.
Caveats from LA watershed resources staff: Annuals inflate recruitment area. If credited as recruitment in 2017 but empty in 2022, drop from the 25% share (annual signal; perennial mortality is an alternate assumption). Lateral growth ≠ recruitment on LPI alone; sample ≠ whole site without a sampling frame.
Going forward (ICWD): treat 2022 as baseline; compare expected 2024 3DEP LiDAR to 2022 and to 2025 transects; refine baseline before the next high-res flight.
Compliance method (from LADWP 1991 EIR REVEGETATION DATA-MASTER.xlsm): cover is met when the upper 80% confidence interval of mean transect cover reaches 90% of the Table 2 cover goal (upper CI80 ≥ 0.9 × goal). Species composition is met when observed richness reaches 75% of the Table 2 species goal. The 80% CI uses mean + t₀.₉,ₙ₋₁ × SD / √n across transects (or segments, for 2025).
This report compares 2025 live native perennial cover, upper 80% CI, and native perennial species with ≥3 hits to those targets. Cover and species metrics use the same perennial filter as the LADWP master workbook (Lifecycle contains “Perennial”). Parcels with missing segment lengths (denominators) are marked incomplete.
Parcel boundaries: AGOL polygons only — no transect buffering. Most parcels use mitigation_sites.shp; LAW118 uses mitigation_view_polygons.geojson; TIN054 uses the experimental plot in data/gis/TIN054.json. TIN054 transect geometry is TBD (current post pairing draws incorrectly; map left blank until remapped).
Compliance against Table 2 cover and composition criteria is shown in Table 1.
Fig. 6 shows mitigation parcel boundaries (grey fill), transect segment lines connecting post pairs, and 2025 posts colored by cover. Click a parcel, line, or post for summary stats. Per-site static maps with post labels follow below.2
Each section shows the mitigation site boundary, transect segment lines, labeled posts (2025 cover), a cover trend plot (Table 2 goal, 90% compliance threshold, upper 80% CI), summary statistics, and goal status.
TOC / jump labels use: ⚠️ = cover + composition met (2025), sustainability not yet demonstrated; ❔ = assessment incomplete; no mark = cover and/or composition not met.
Jump to parcel: BGP160E · BGP160W · BIS097 · ⚠️ BLK16E · ⚠️ IND105 · ❓ IND123 · ⚠️ IND131N · ❓ IND131S · ⚠️ LAW118 · TIN054
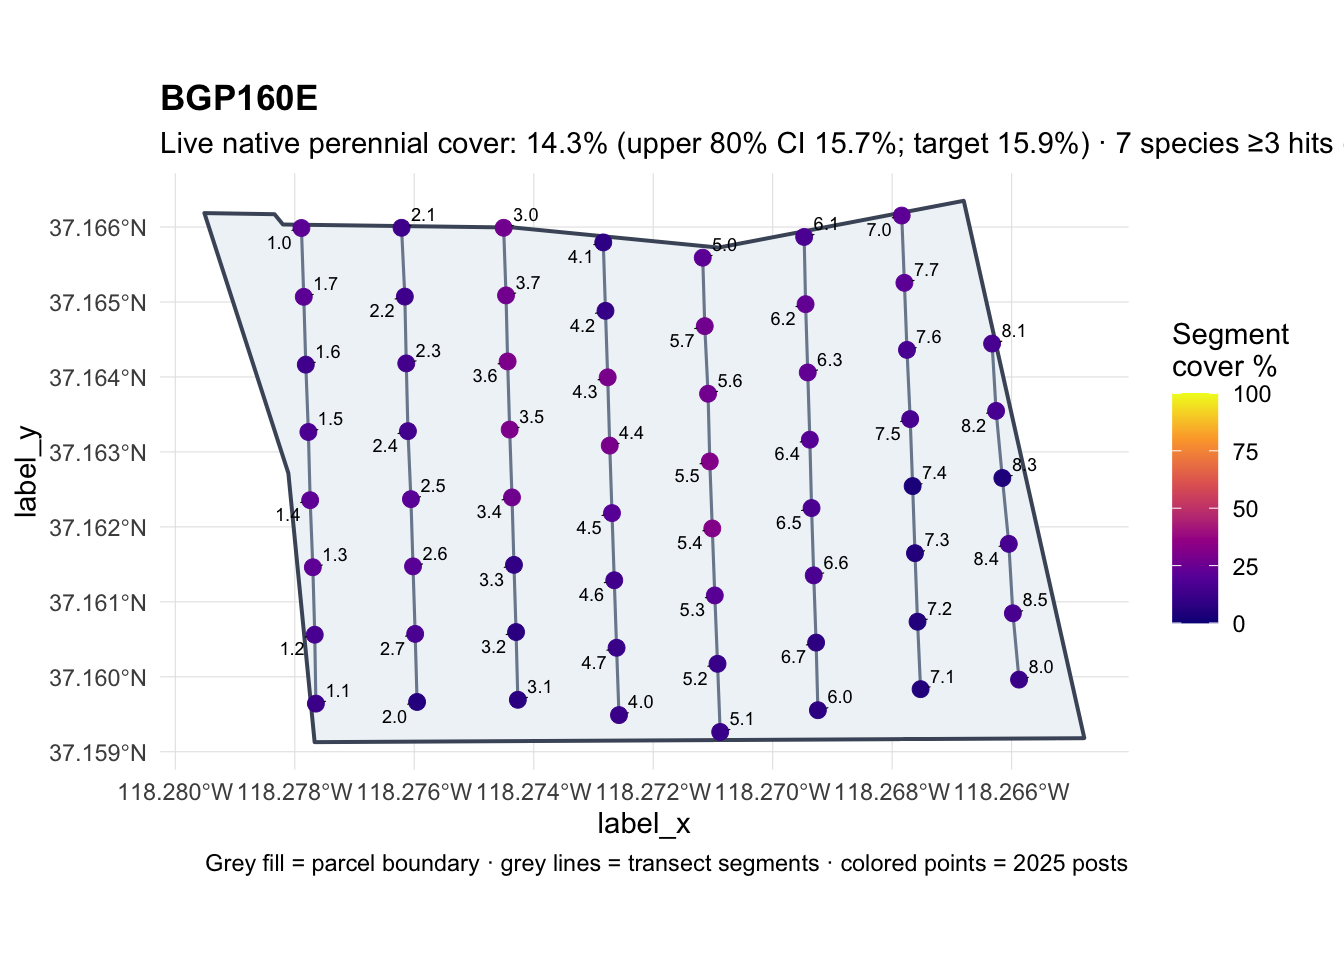
Survey date: 2025-08-18 · Quad: BGP · Mitigation acres (AGOL): 209.5
| Metric | 2025 | Target | Status |
|---|---|---|---|
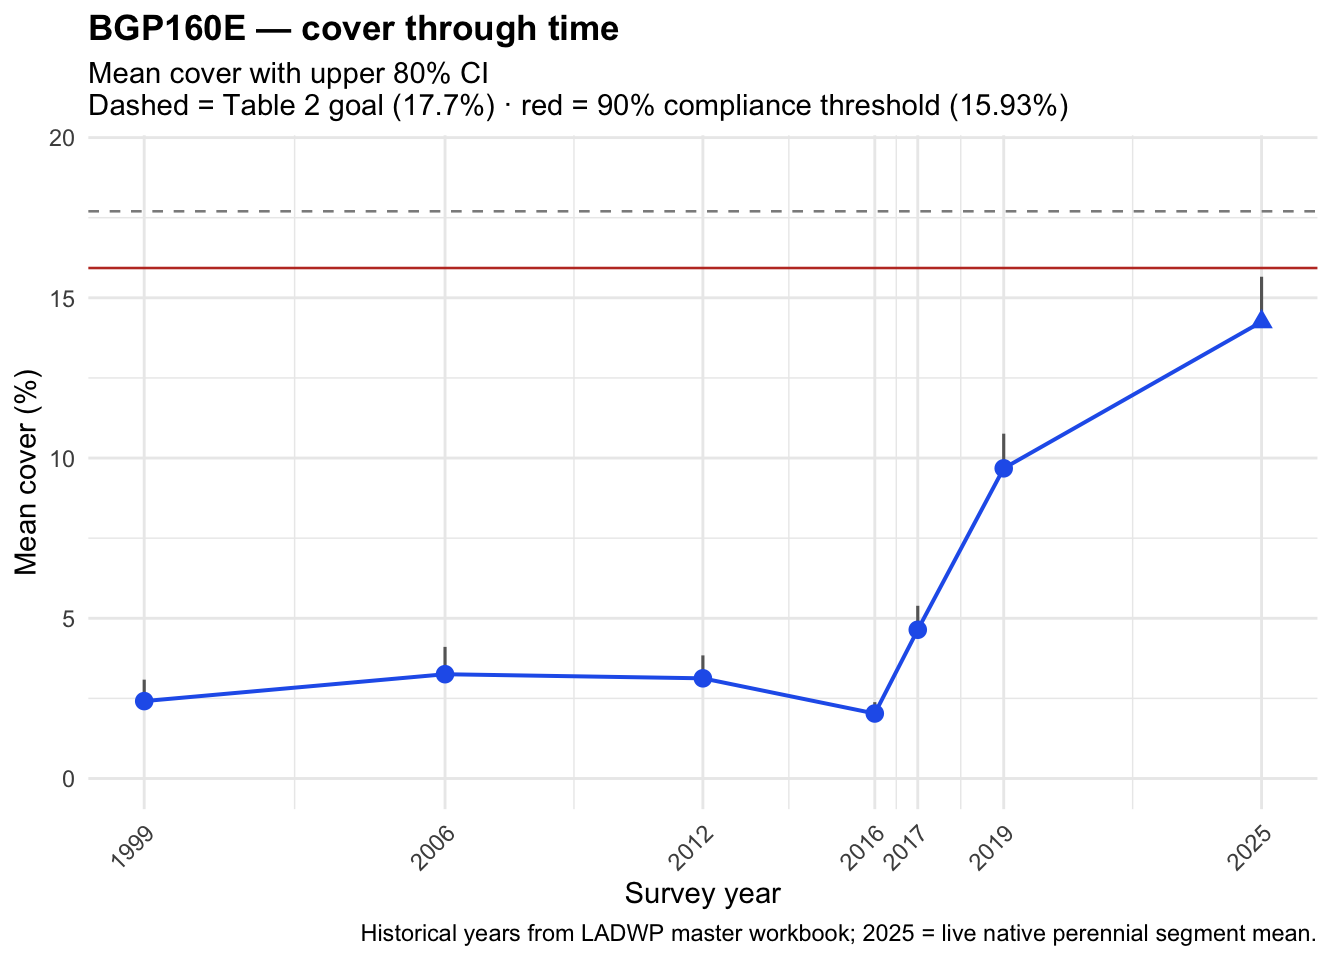
| Live native cover (parcel mean) | 14.27253% | 17.7% (Table 2) | — |
| Upper 80% CI (segment mean) | 15.7% | 15.93% | ❌ |
| Native species (≥3 hits) | 7 | 7.5 | ❌ |
| Overall | Not met |
Map: parcel boundary (grey), transect segments (lines), and posts colored by 2025 percent cover.
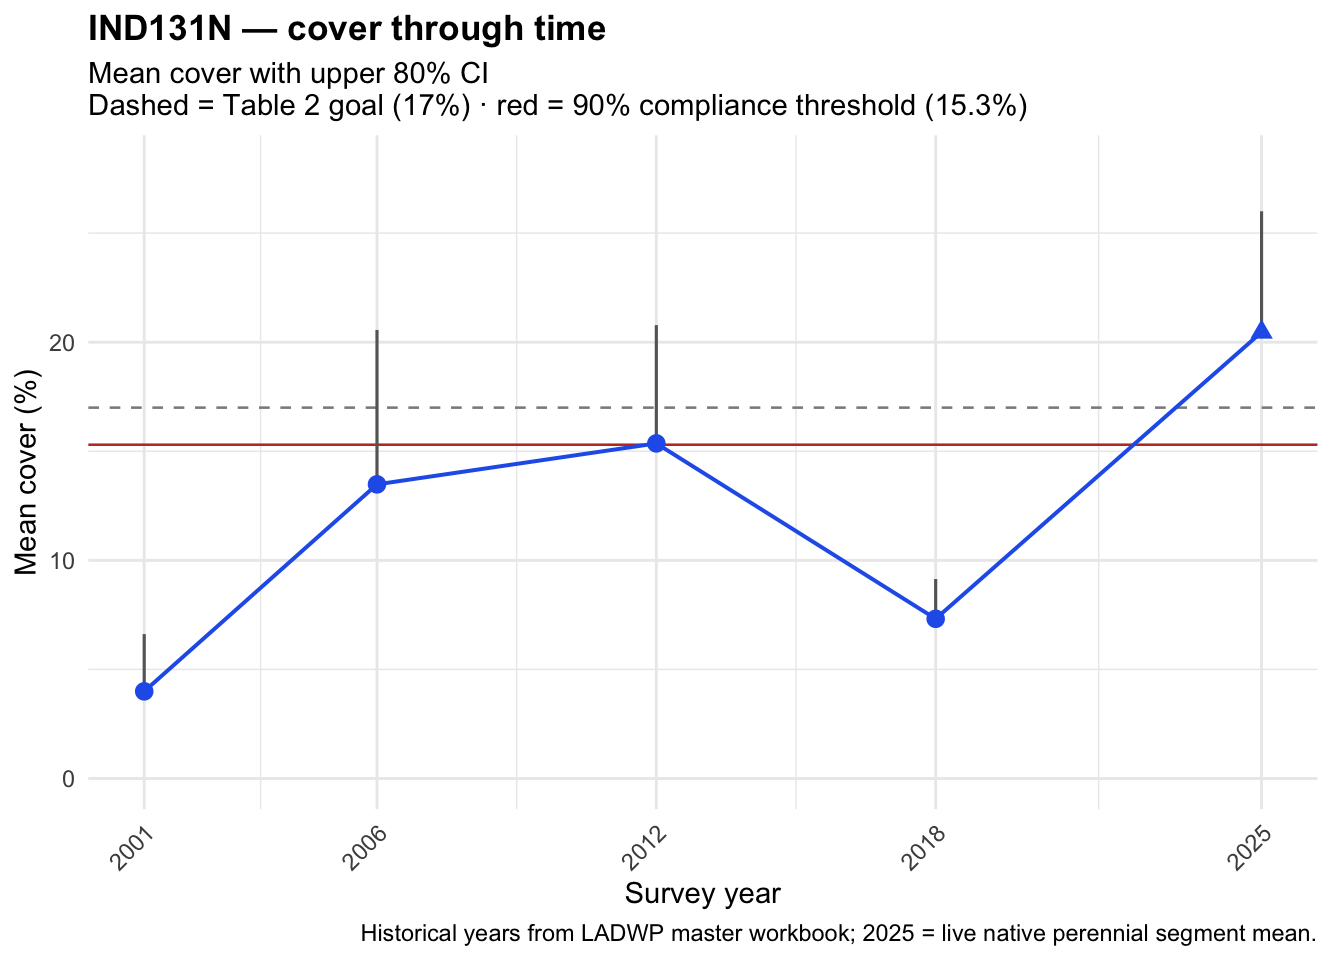
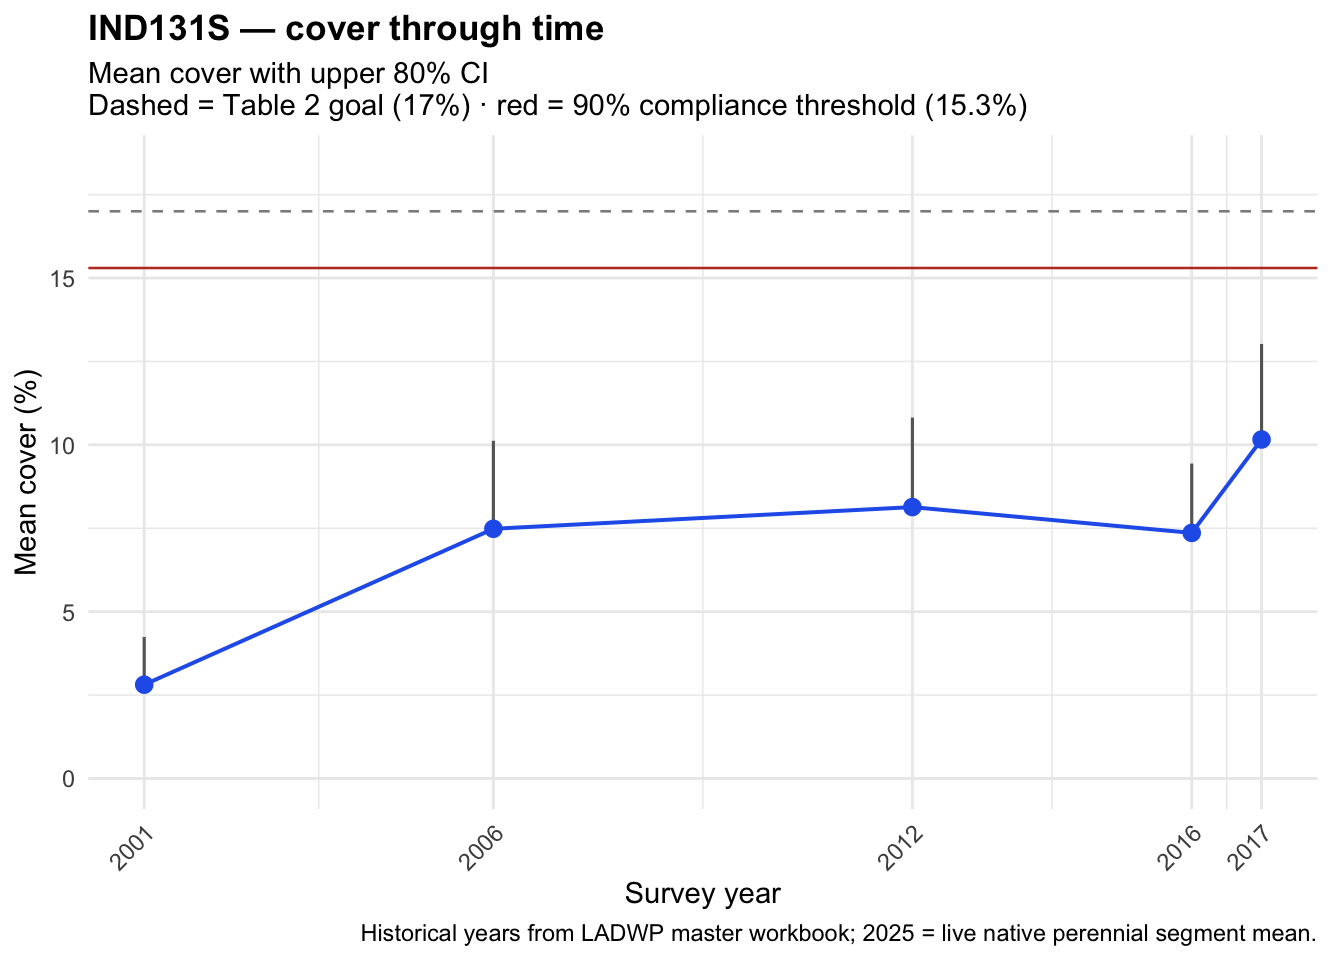
Cover trend: mean cover with upper 80% CI; dashed line = Table 2 goal; red line = 90% compliance threshold.
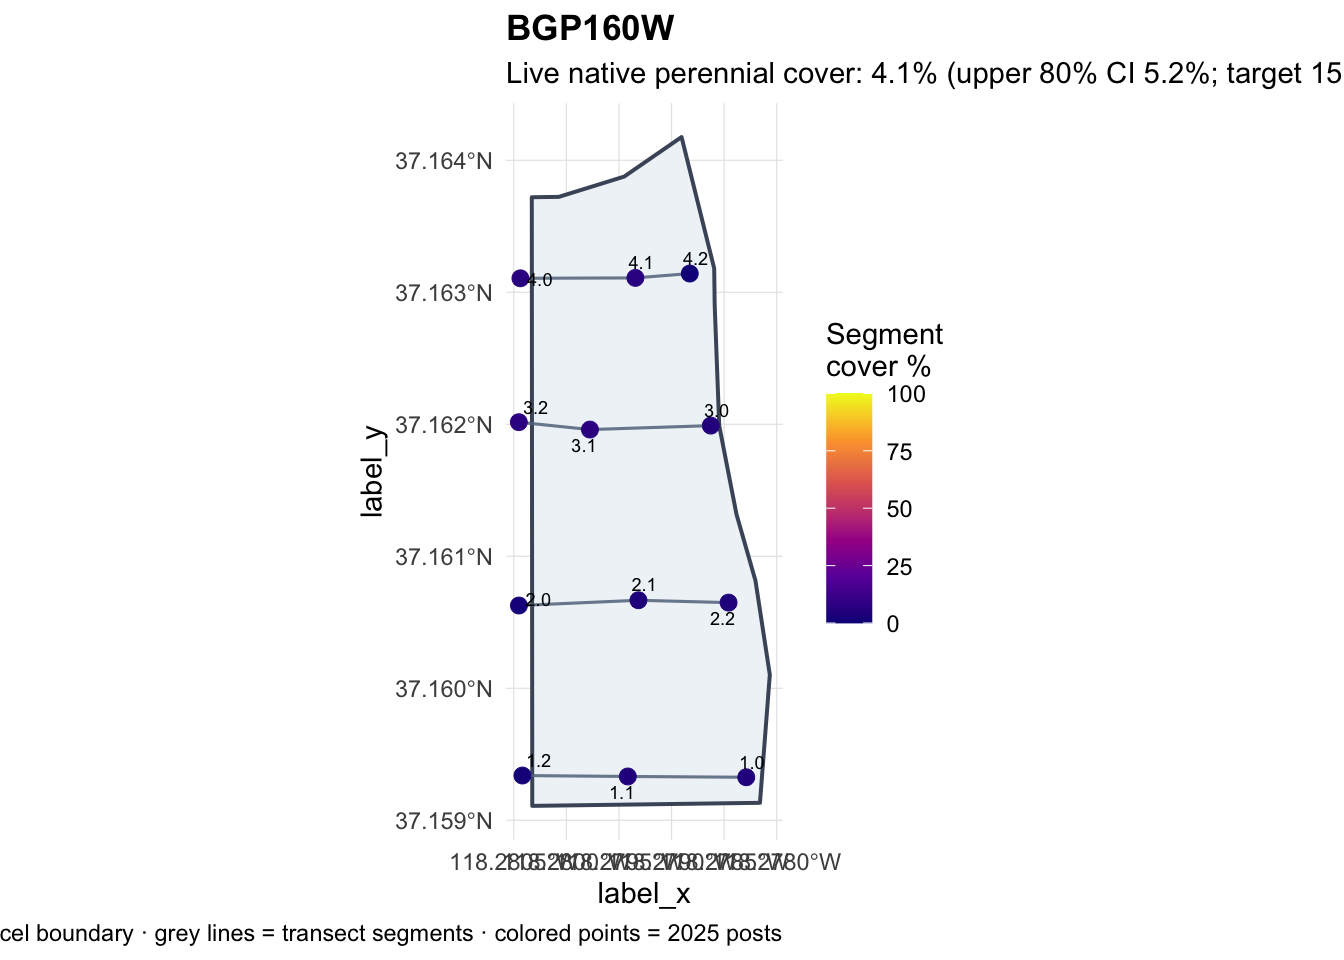
Survey date: 2025-08-18 · Quad: BGP · Mitigation acres (AGOL): 22.5
| Metric | 2025 | Target | Status |
|---|---|---|---|
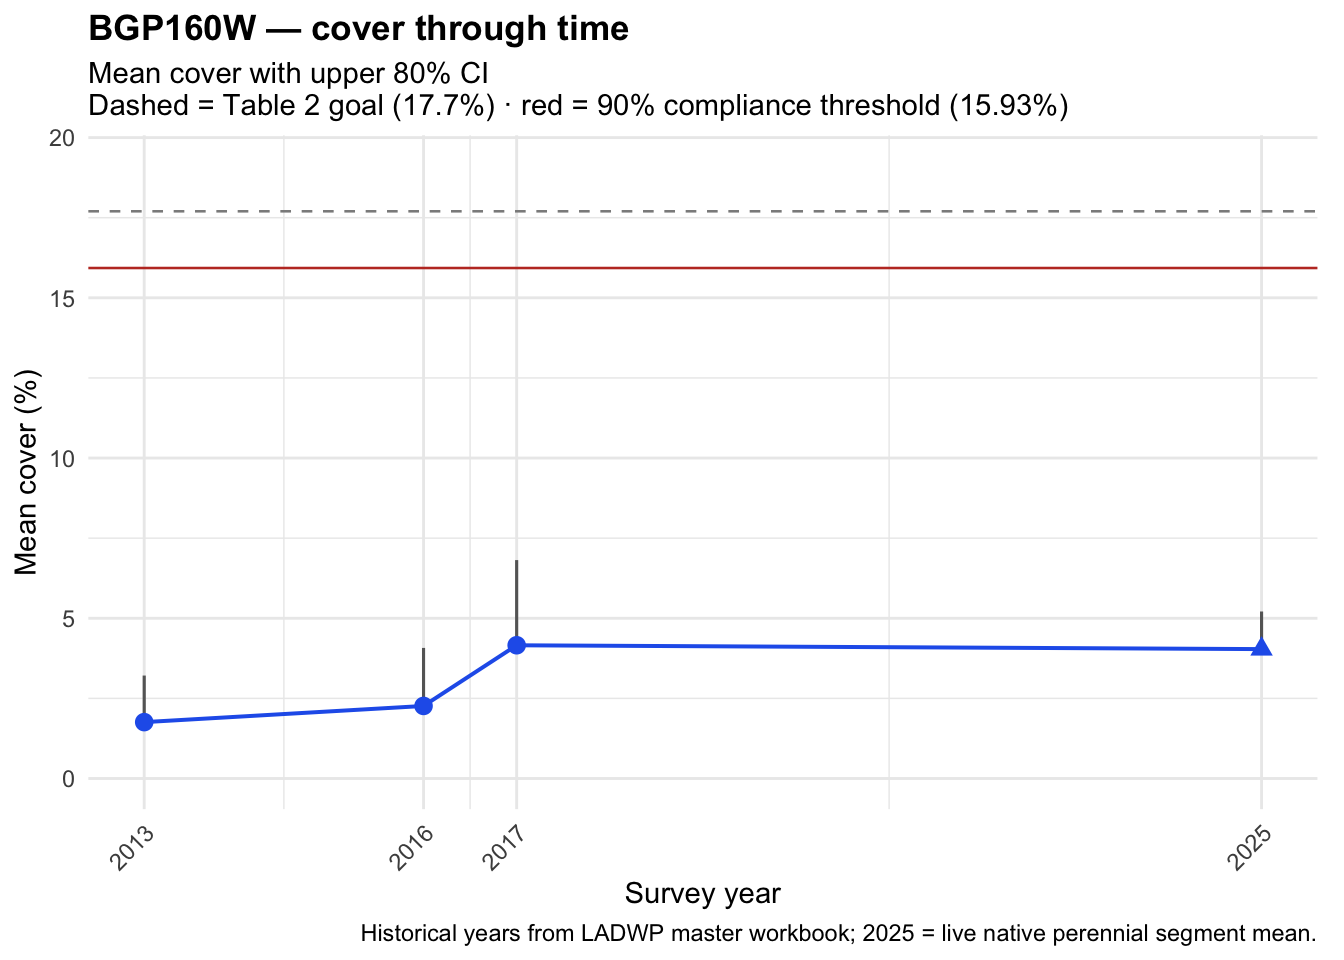
| Live native cover (parcel mean) | 4.098361% | 17.7% (Table 2) | — |
| Upper 80% CI (segment mean) | 5.2% | 15.93% | ❌ |
| Native species (≥3 hits) | 4 | 7.5 | ❌ |
| Overall | Not met |
Map: parcel boundary (grey), transect segments (lines), and posts colored by 2025 percent cover.
Cover trend: mean cover with upper 80% CI; dashed line = Table 2 goal; red line = 90% compliance threshold.
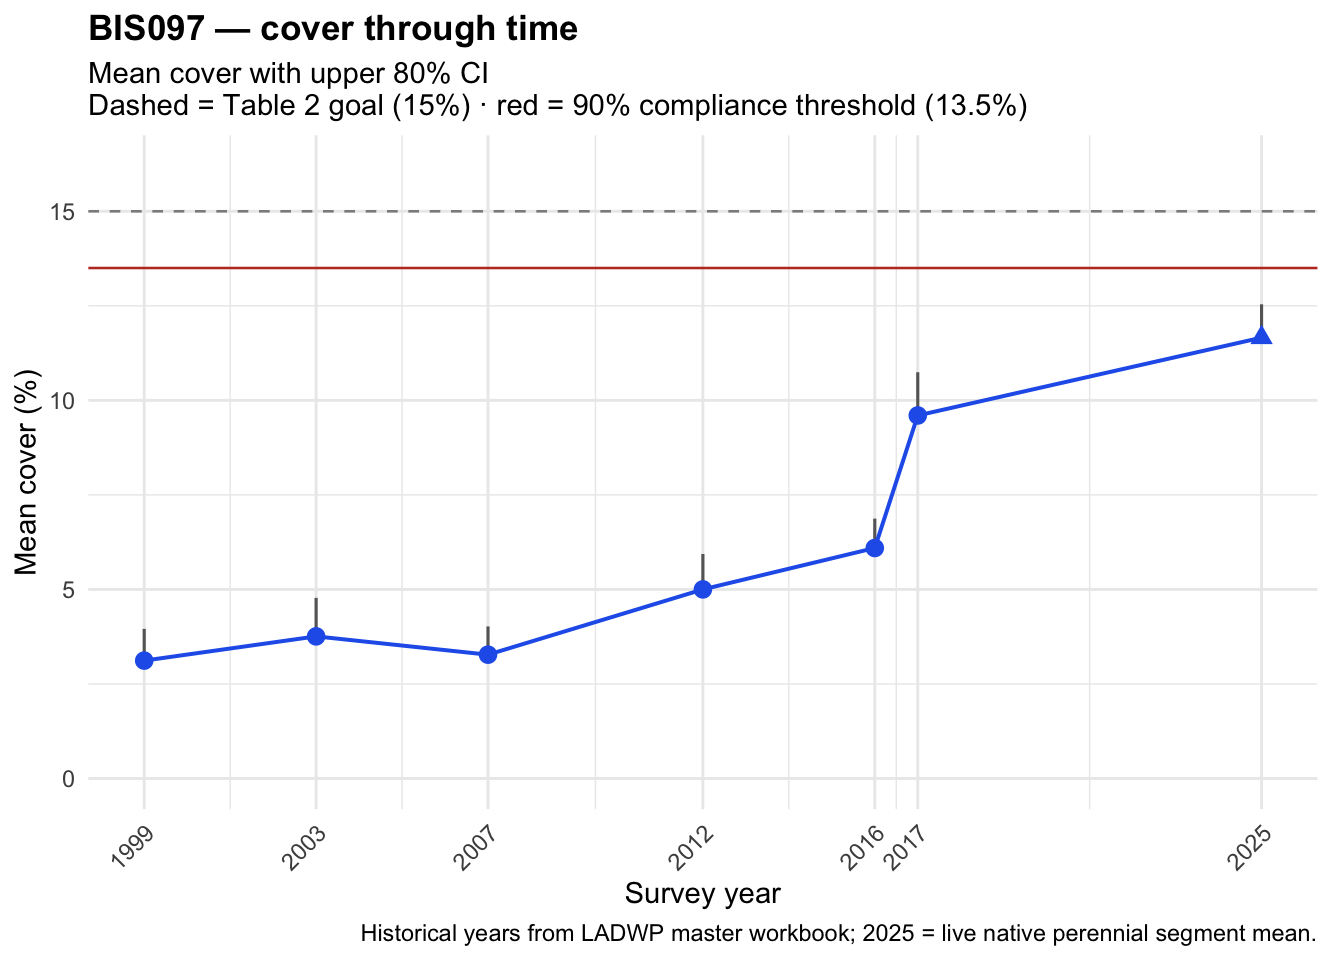
Survey date: 2025-08-20 · Quad: BIS · Mitigation acres (AGOL): 112.7
| Metric | 2025 | Target | Status |
|---|---|---|---|
| Live native cover (parcel mean) | 11.66099% | 15% (Table 2) | — |
| Upper 80% CI (segment mean) | 12.5% | 13.5% | ❌ |
| Native species (≥3 hits) | 3 | 9 | ❌ |
| Overall | Not met |
Map: parcel boundary (grey), transect segments (lines), and posts colored by 2025 percent cover.
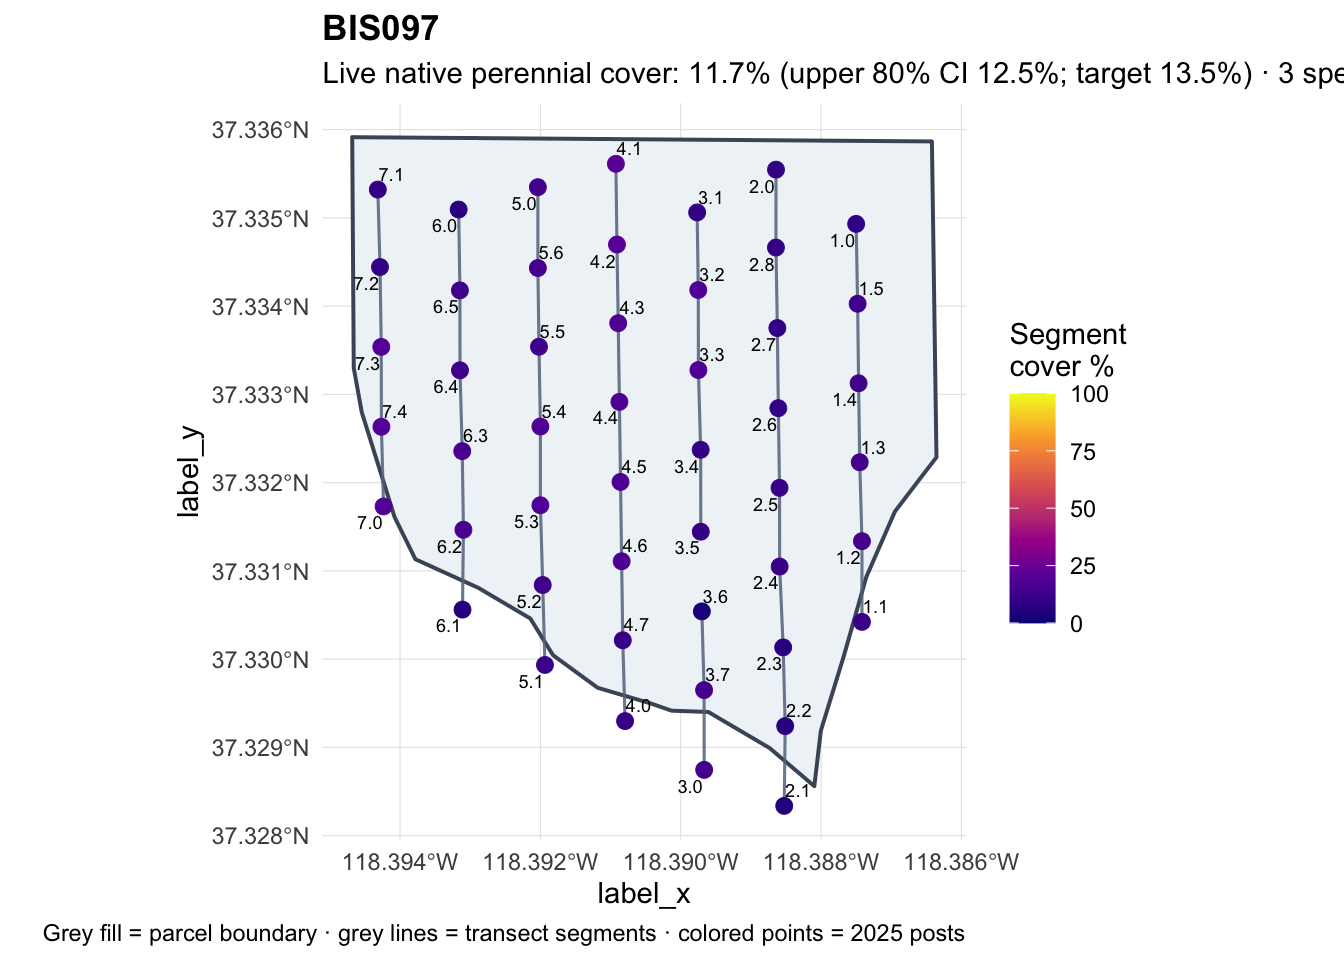
Cover trend: mean cover with upper 80% CI; dashed line = Table 2 goal; red line = 90% compliance threshold.
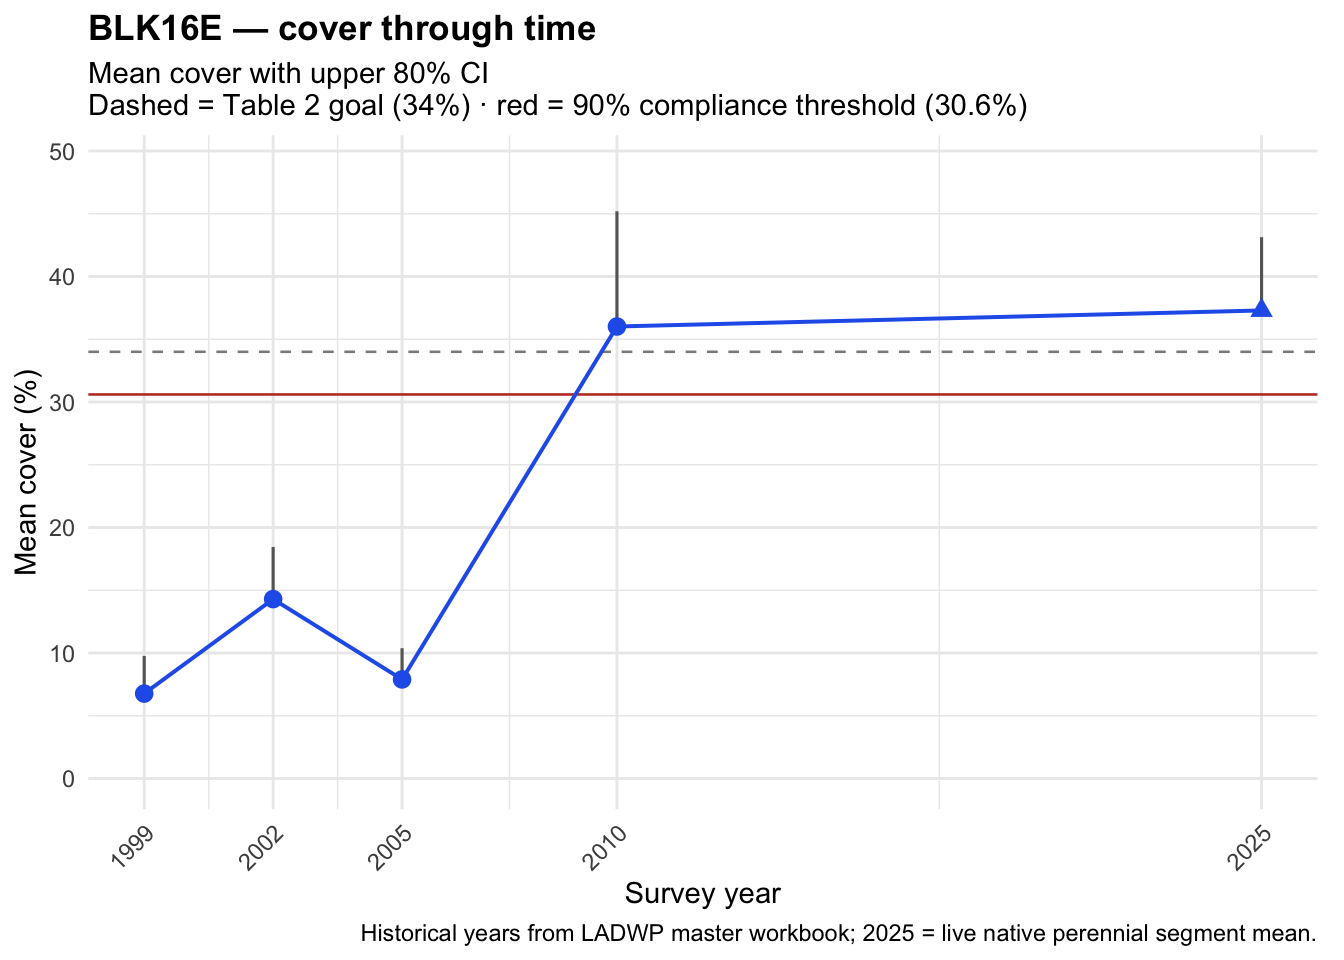
Survey date: 2025-08-13 · Quad: BKK · Mitigation acres (AGOL): 7.4
| Metric | 2025 | Target | Status |
|---|---|---|---|
| Live native cover (parcel mean) | 36.86594% | 34% (Table 2) | — |
| Upper 80% CI (segment mean) | 43.1% | 30.6% | ✅ |
| Native species (≥3 hits) | 9 | 4.5 | ✅ |
| Overall | Met |
Map: parcel boundary (grey), transect segments (lines), and posts colored by 2025 percent cover.
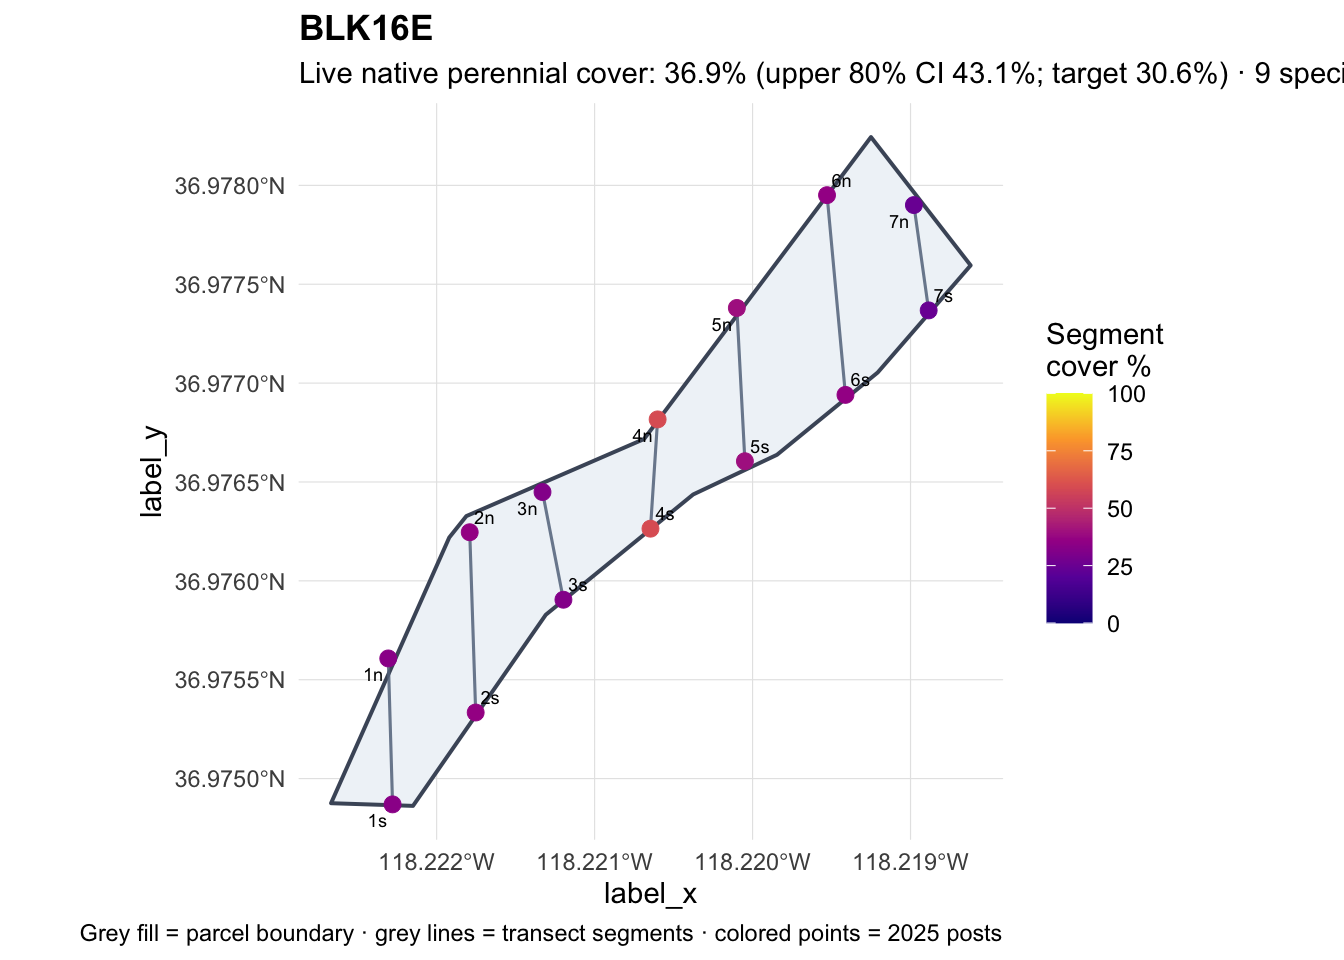
Cover trend: mean cover with upper 80% CI; dashed line = Table 2 goal; red line = 90% compliance threshold.
Survey date: 2025-08-13 · Quad: IND · Mitigation acres (AGOL): 13.6
| Metric | 2025 | Target | Status |
|---|---|---|---|
| Live native cover (parcel mean) | 24.38178% | 17% (Table 2) | — |
| Upper 80% CI (segment mean) | 31.1% | 15.3% | ✅ |
| Native species (≥3 hits) | 3 | 3 | ✅ |
| Overall | Met |
Map: parcel boundary (grey), transect segments (lines), and posts colored by 2025 percent cover.
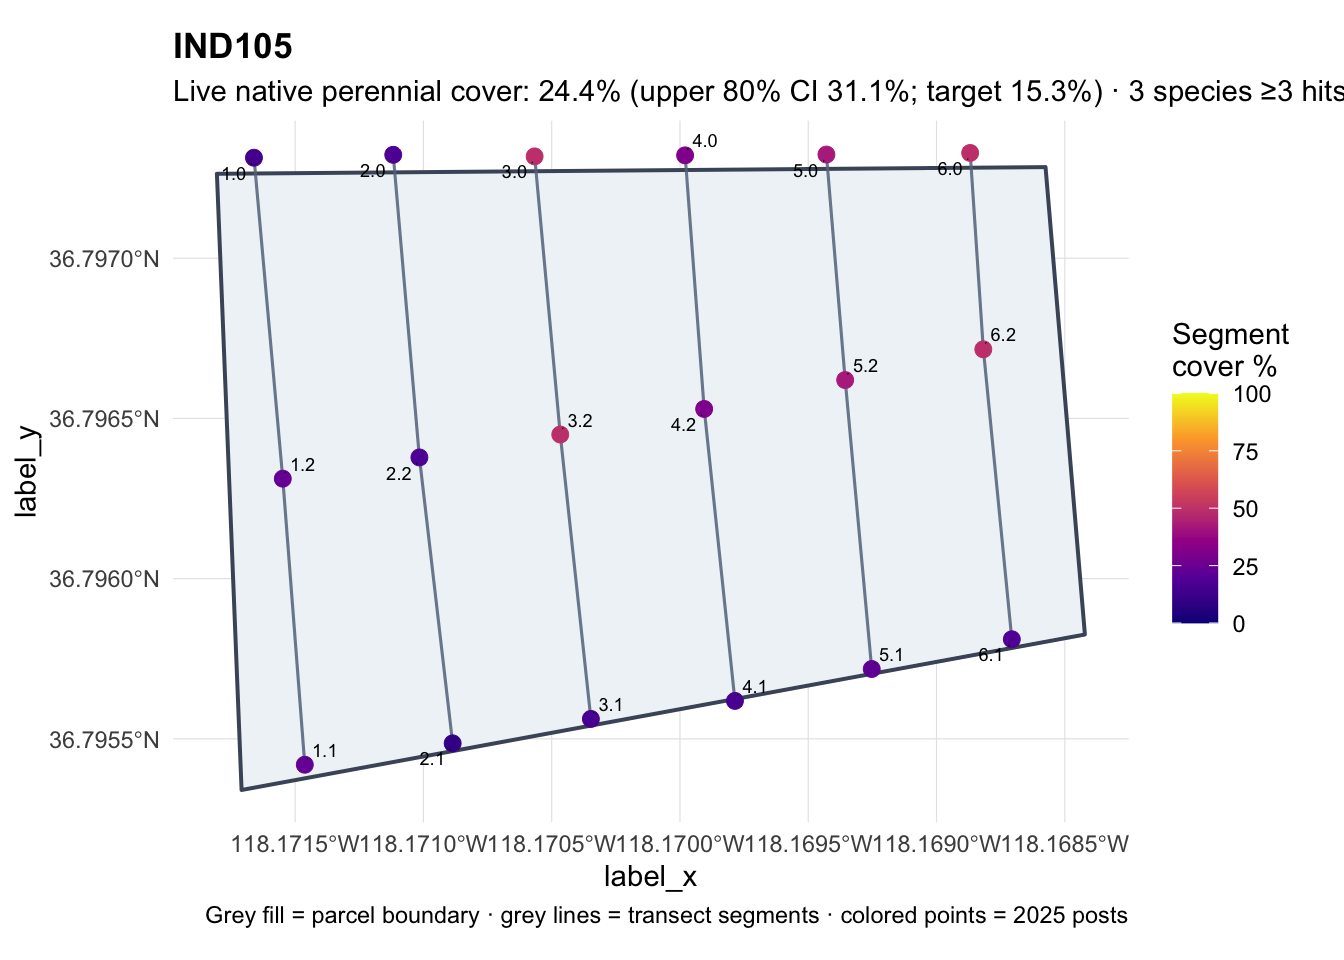
Cover trend: mean cover with upper 80% CI; dashed line = Table 2 goal; red line = 90% compliance threshold.
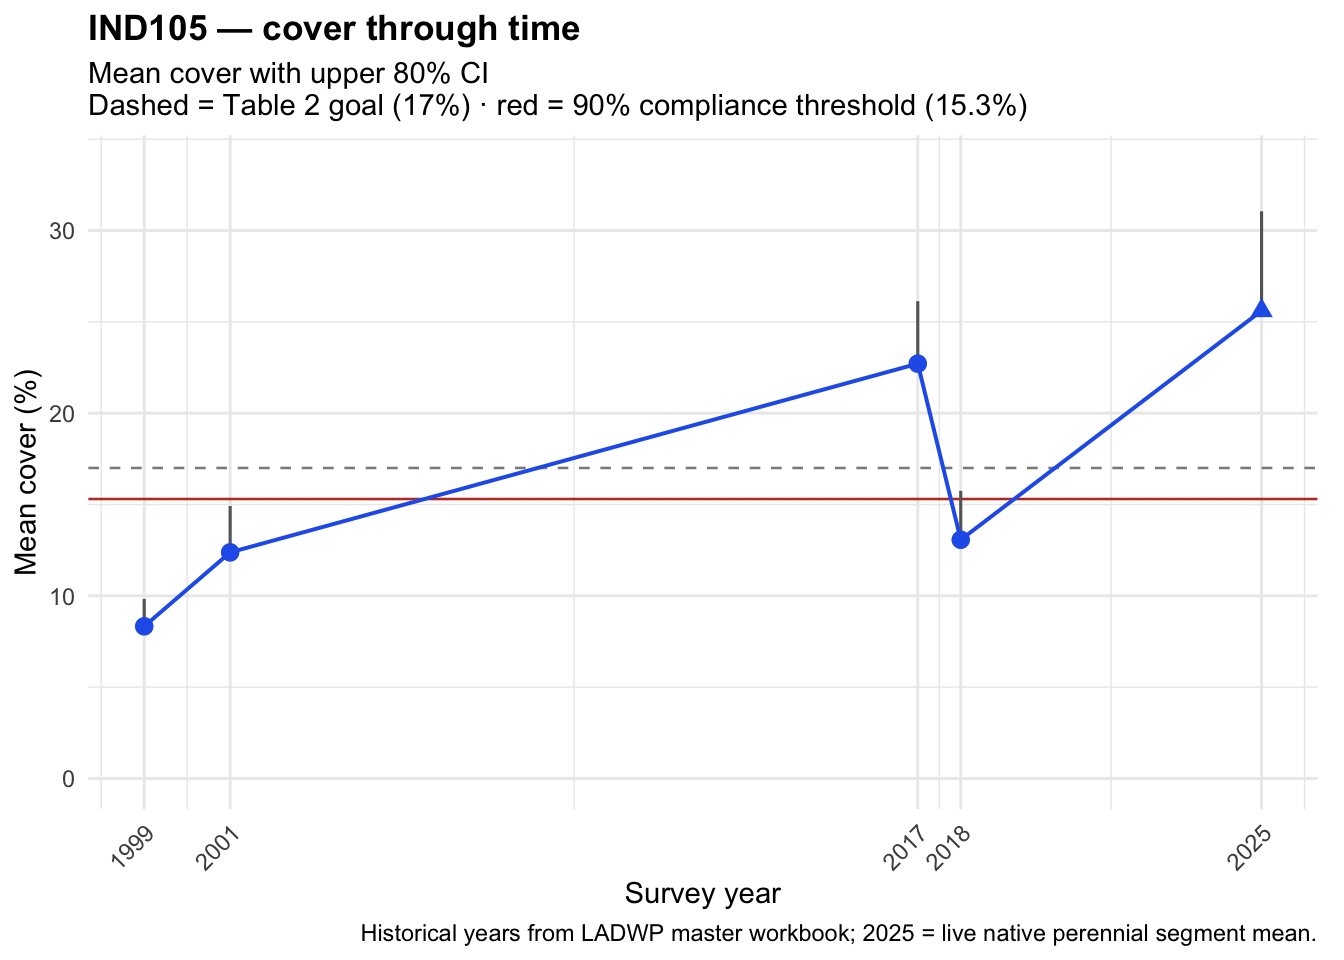
Survey date: 2025-08-12 · Quad: IND · Mitigation acres (AGOL): 28.4
Assessment incomplete — 1 segment(s) lack GIS length/denominator.
Map: parcel boundary (grey), transect segments (lines), and posts colored by 2025 percent cover.
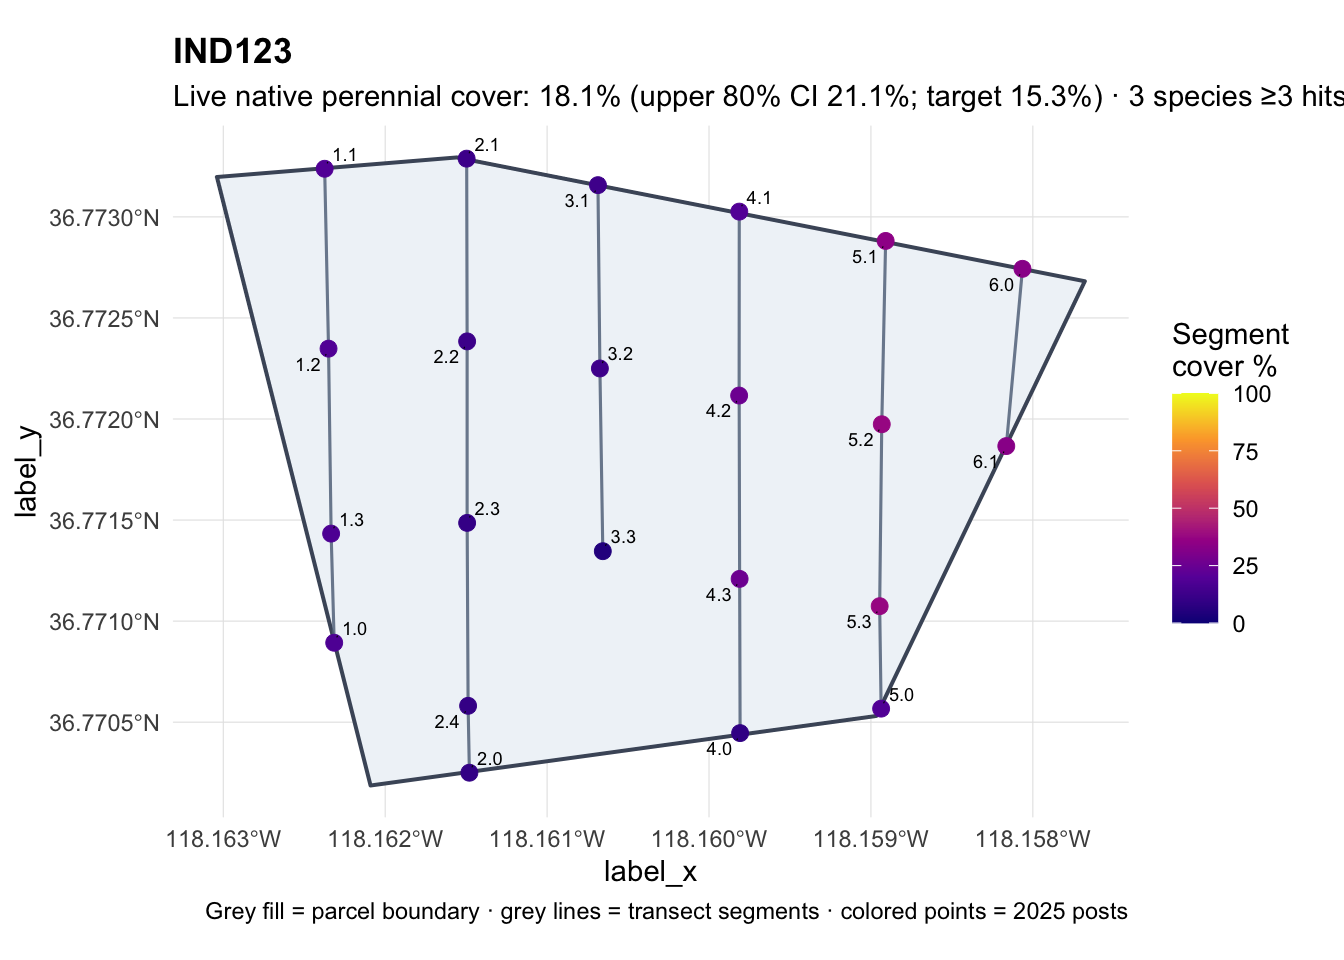
Cover trend: mean cover with upper 80% CI; dashed line = Table 2 goal; red line = 90% compliance threshold.
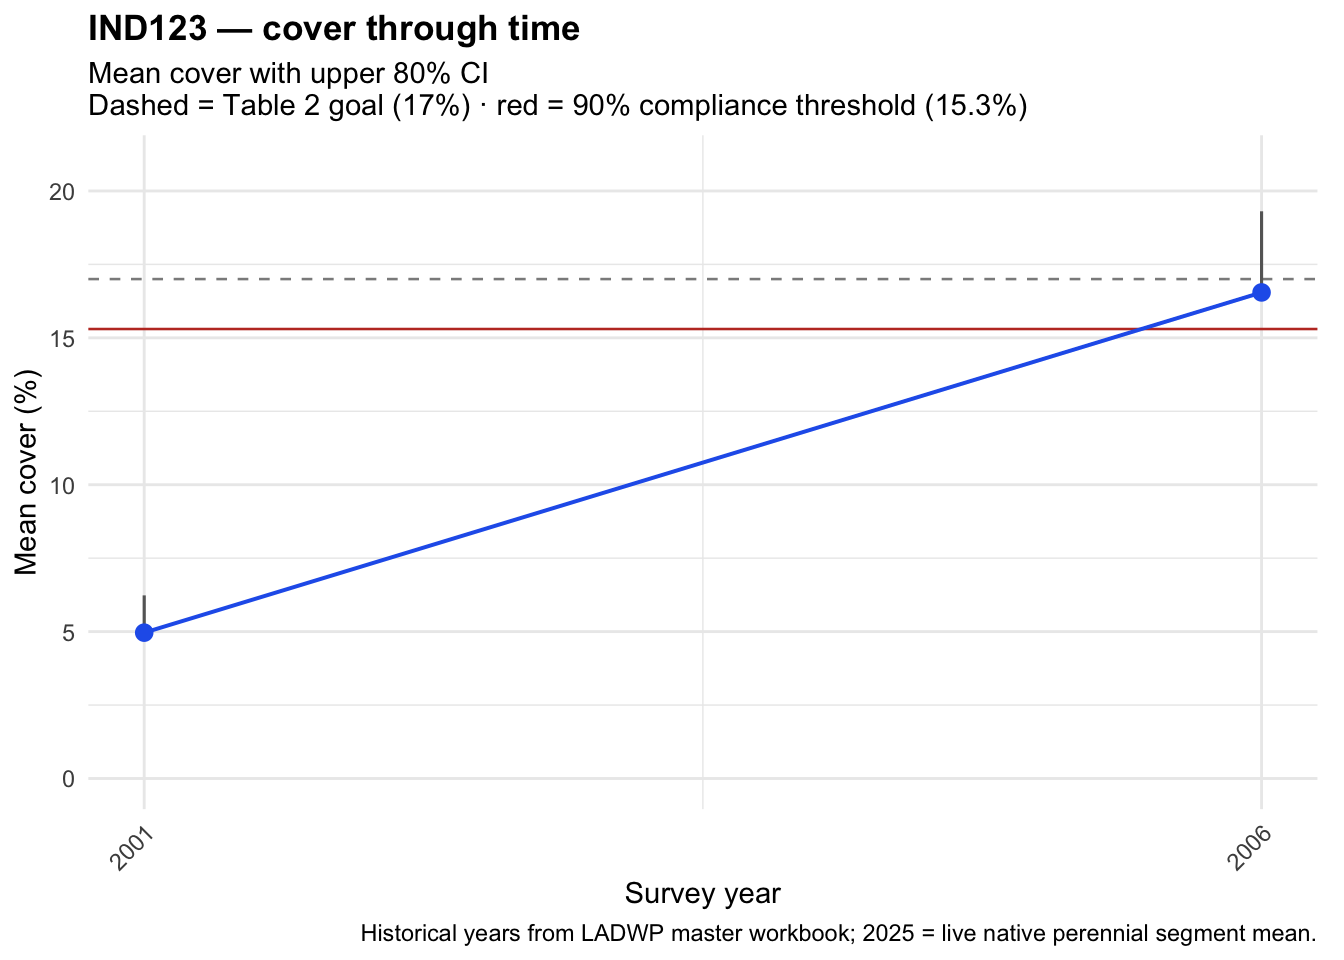
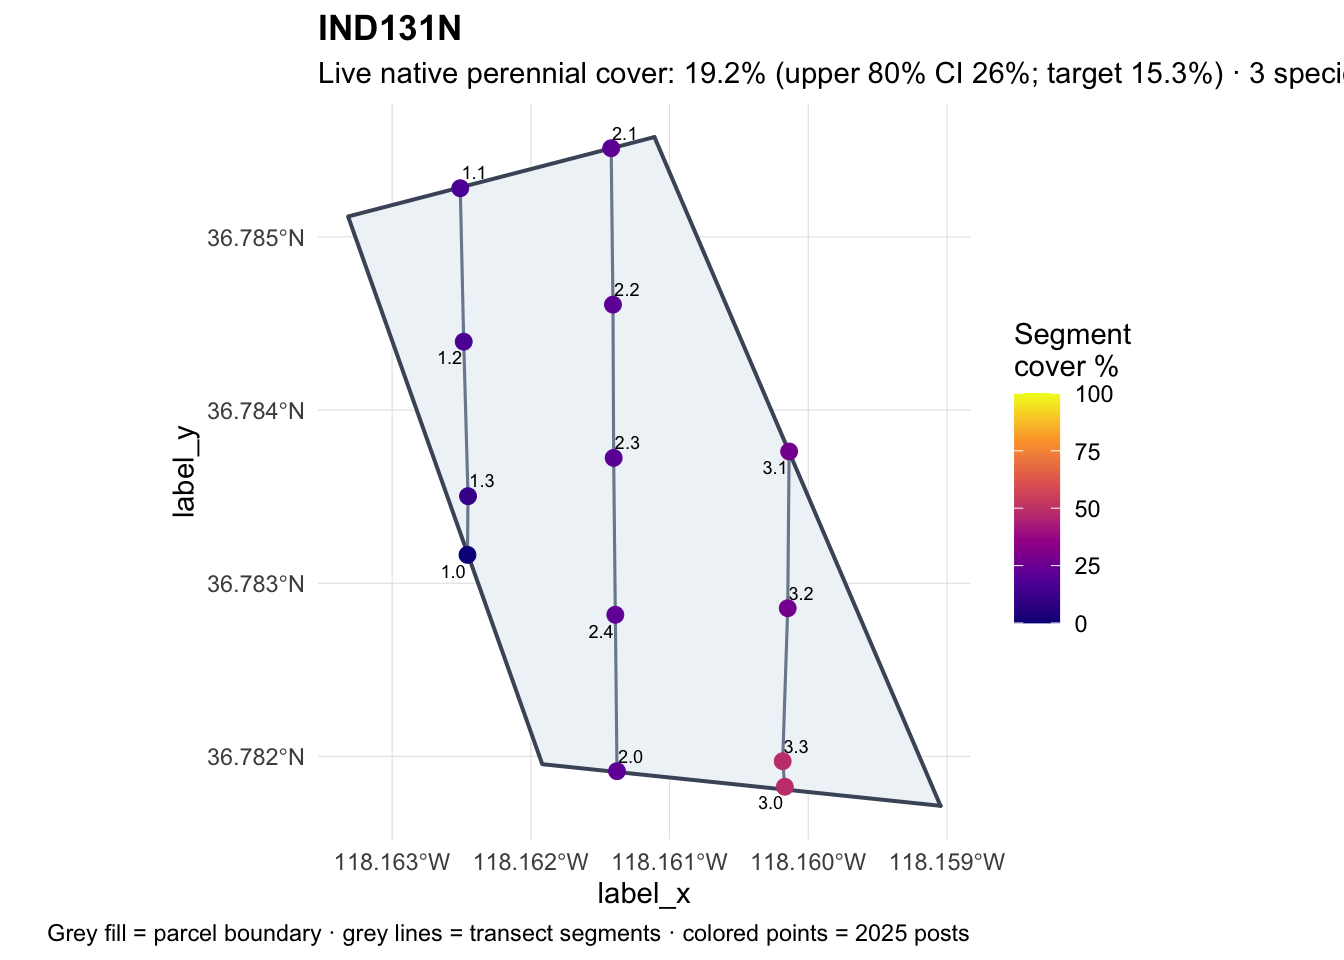
Survey date: 2025-08-13 · Quad: IND · Mitigation acres (AGOL): 22.3
| Metric | 2025 | Target | Status |
|---|---|---|---|
| Live native cover (parcel mean) | 19.22399% | 17% (Table 2) | — |
| Upper 80% CI (segment mean) | 26% | 15.3% | ✅ |
| Native species (≥3 hits) | 3 | 3 | ✅ |
| Overall | Met |
Map: parcel boundary (grey), transect segments (lines), and posts colored by 2025 percent cover.
Cover trend: mean cover with upper 80% CI; dashed line = Table 2 goal; red line = 90% compliance threshold.
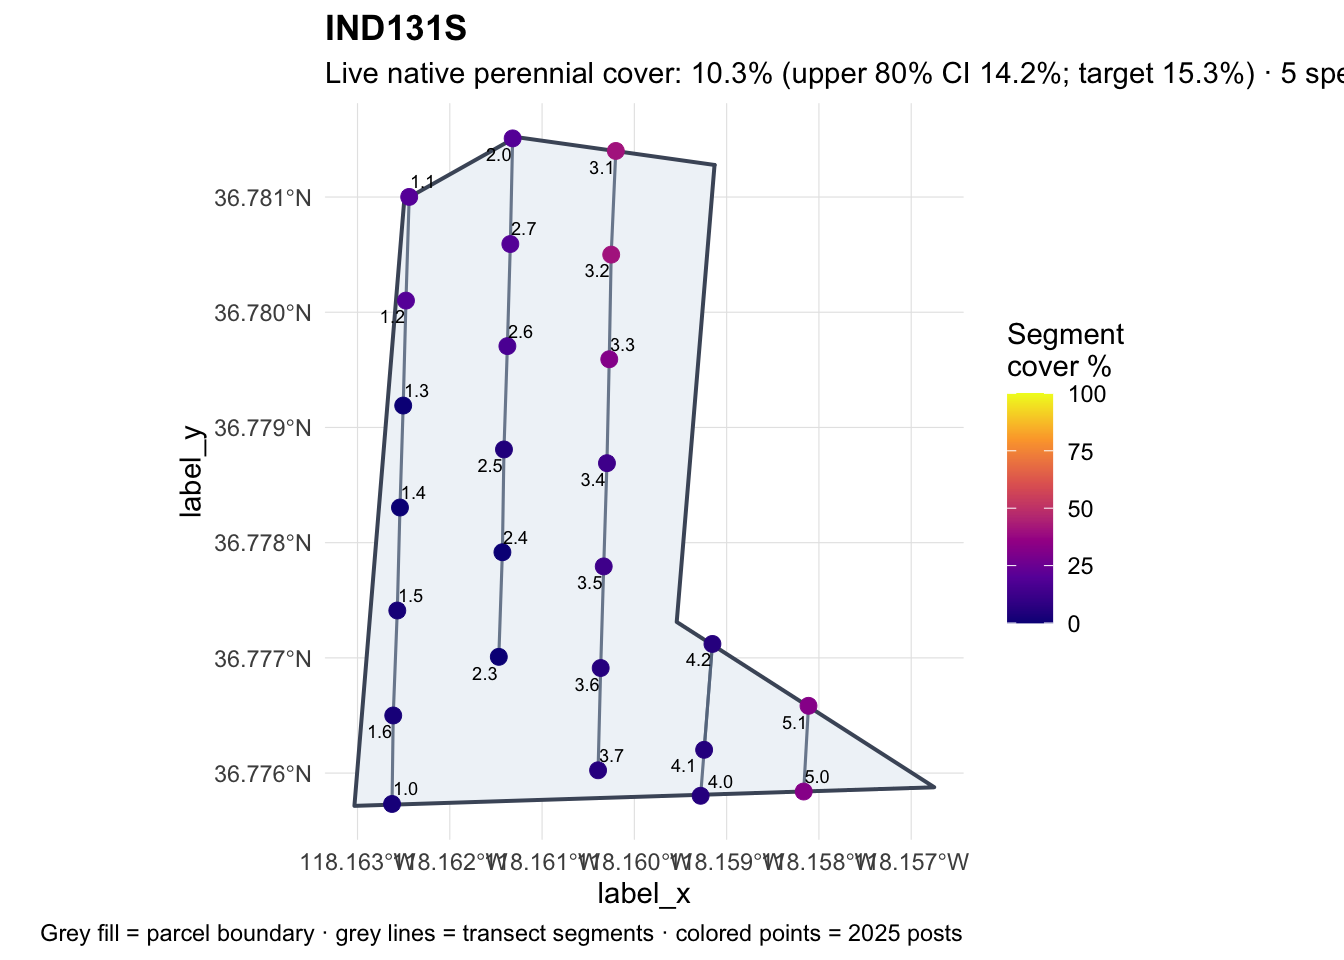
Survey date: 2025-08-12 · Quad: IND · Mitigation acres (AGOL): 51
Assessment incomplete — 3 segment(s) lack GIS length/denominator.
Map: parcel boundary (grey), transect segments (lines), and posts colored by 2025 percent cover.
Cover trend: mean cover with upper 80% CI; dashed line = Table 2 goal; red line = 90% compliance threshold.
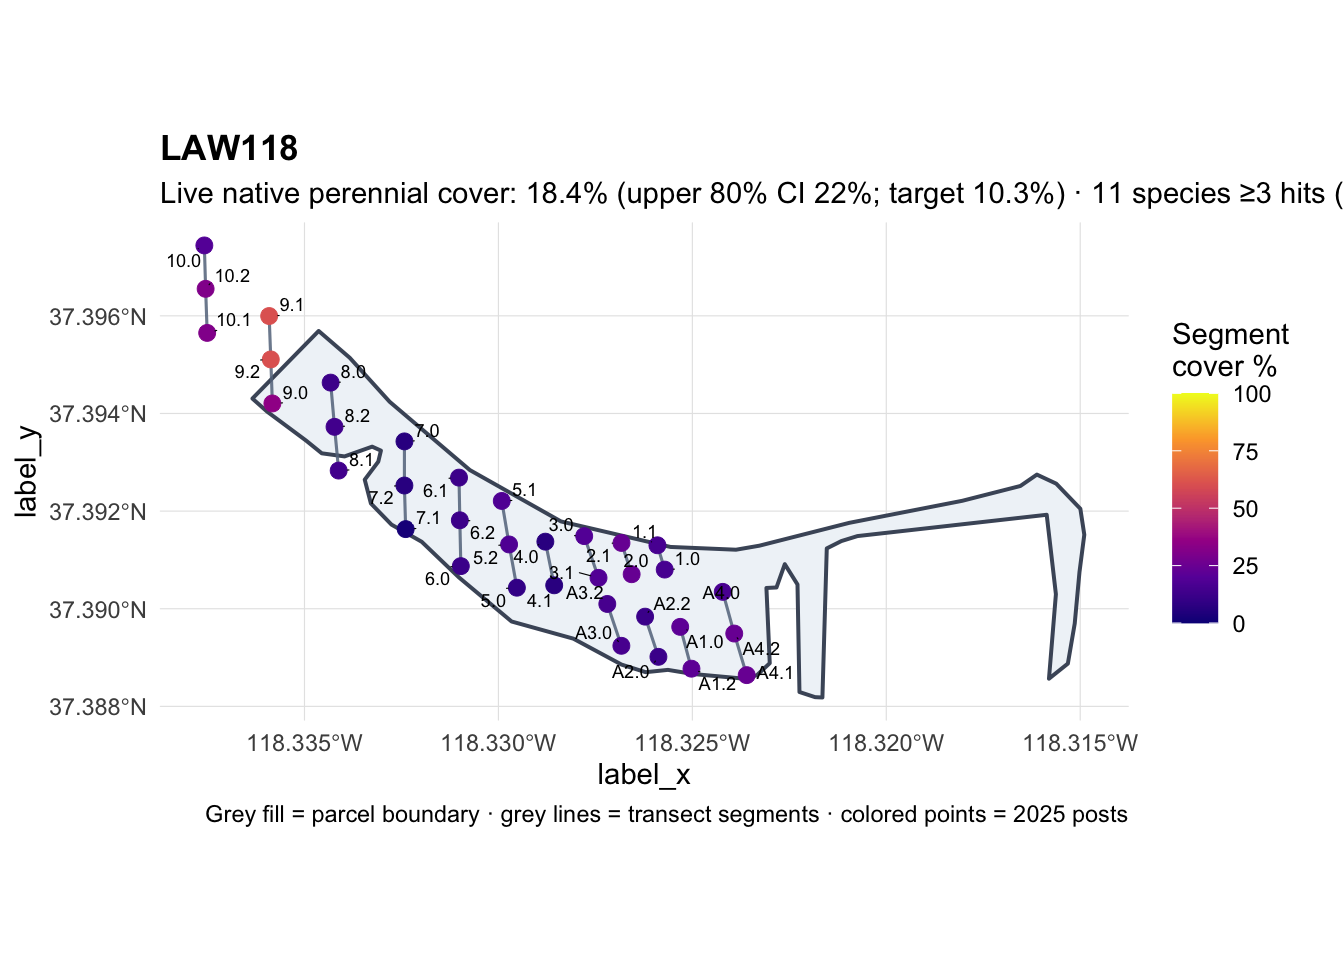
Survey date: 2025-08-20 · Quad: LAW · Mitigation acres (AGOL): 93.5
| Metric | 2025 | Target | Status |
|---|---|---|---|
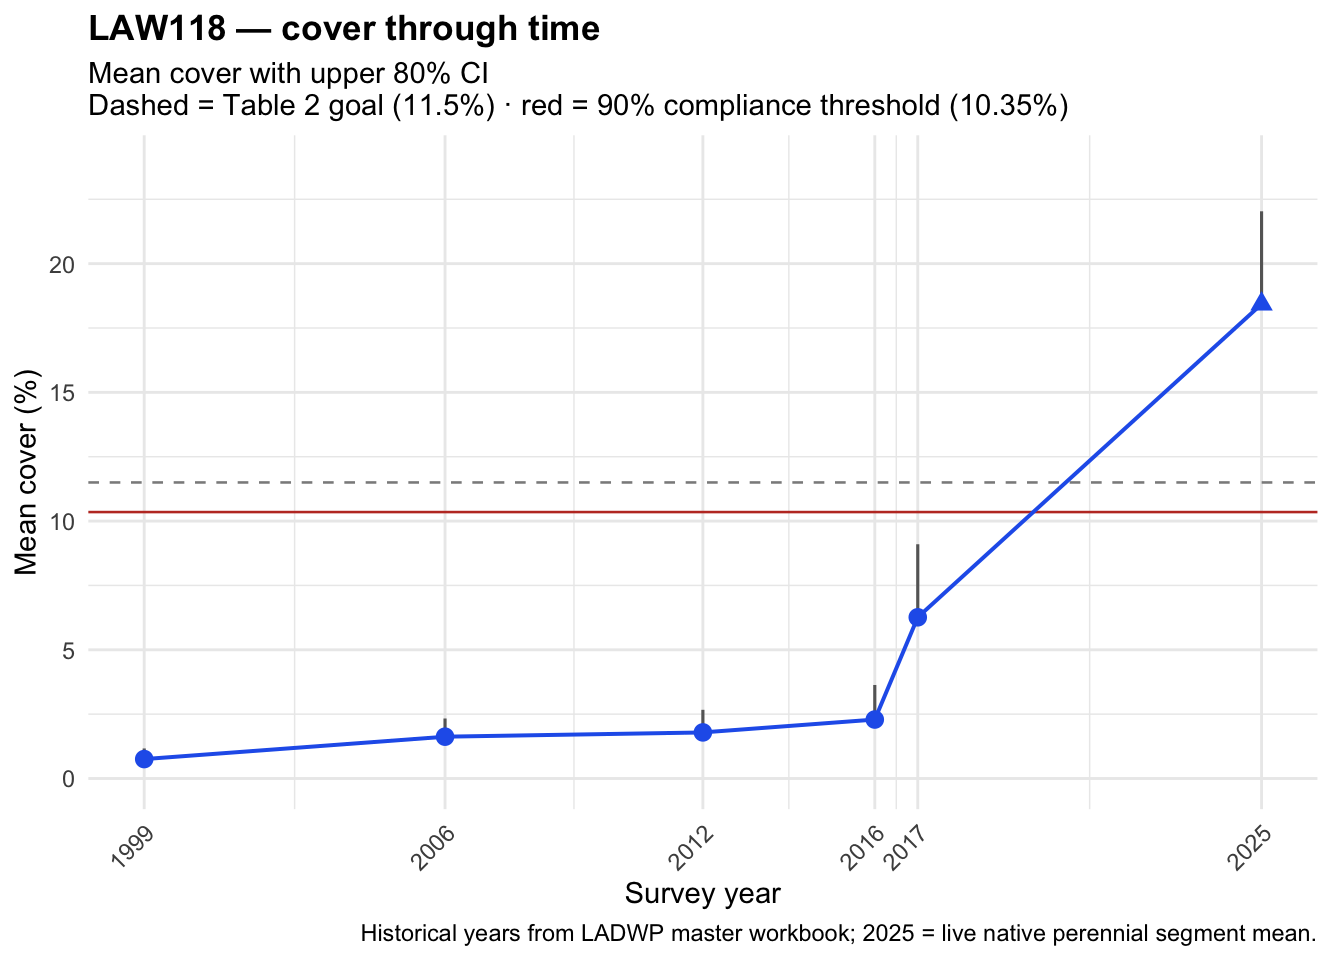
| Live native cover (parcel mean) | 18.39901% | 11.5% (Table 2) | — |
| Upper 80% CI (segment mean) | 22% | 10.35% | ✅ |
| Native species (≥3 hits) | 11 | 8.25 | ✅ |
| Overall | Met |
Map: parcel boundary (grey), transect segments (lines), and posts colored by 2025 percent cover.
Cover trend: mean cover with upper 80% CI; dashed line = Table 2 goal; red line = 90% compliance threshold.
Survey date: 2025-08-14 · Quad: TIN · Mitigation acres (AGOL): 0.4
| Metric | 2025 | Target | Status |
|---|---|---|---|
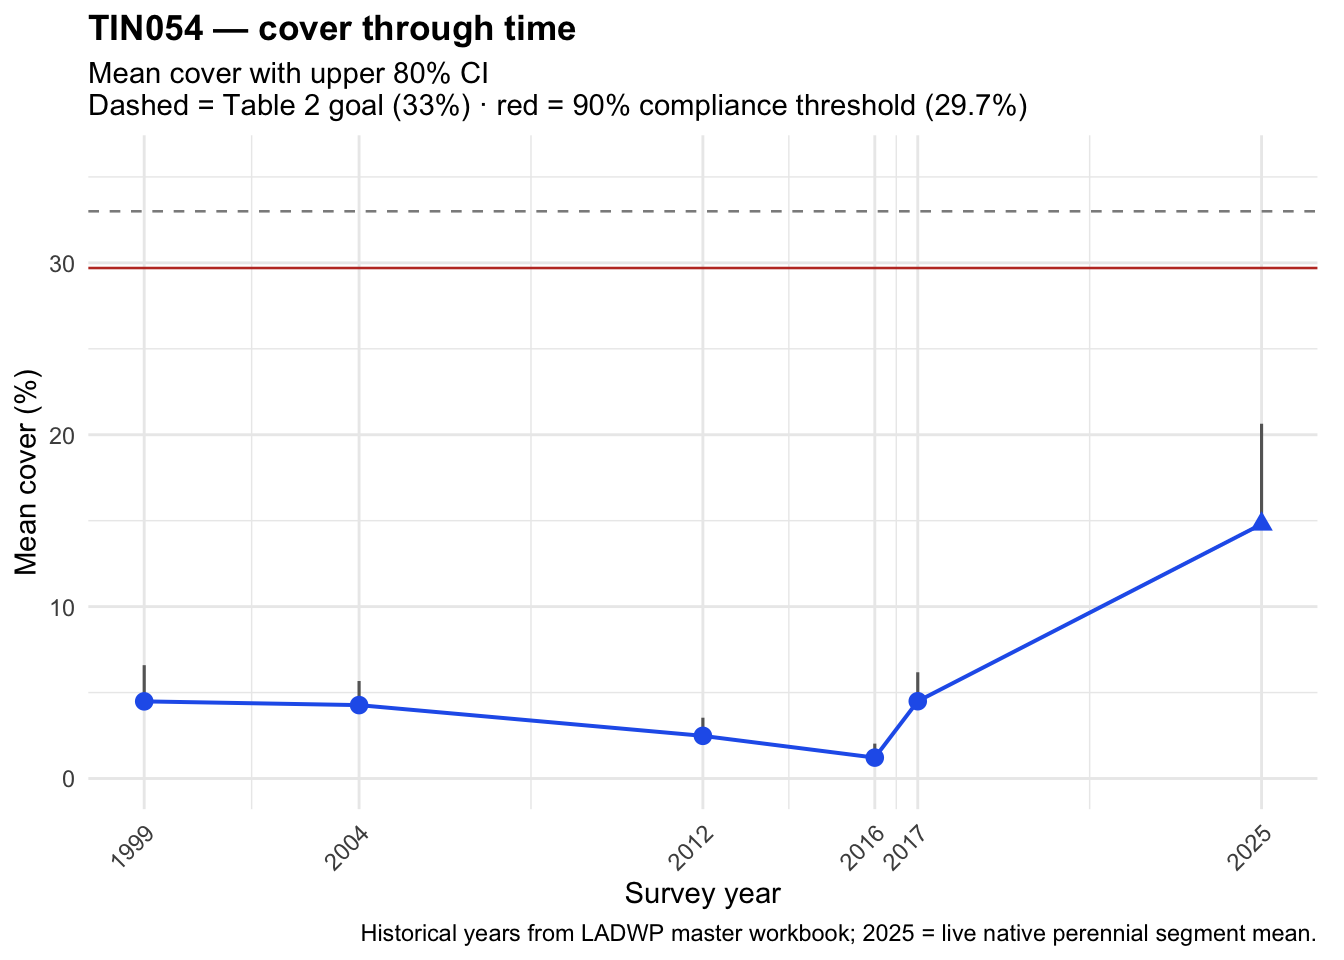
| Live native cover (parcel mean) | 14.37908% | 33% (Table 2) | — |
| Upper 80% CI (segment mean) | 20.6% | 29.7% | ❌ |
| Native species (≥3 hits) | 2 | 2.25 | ❌ |
| Overall | Not met |
Map: parcel boundary (grey), transect segments (lines), and posts colored by 2025 percent cover.
Post/segment pairing is not reliable yet, so the site map is omitted. Cover tables and trend still show; geometry will be added when the layout is confirmed.
Cover trend: mean cover with upper 80% CI; dashed line = Table 2 goal; red line = 90% compliance threshold.
Segment-level cover (Table 2) uses GIS post-to-post lengths as the hit denominator.
Raw species hits by segment are listed in Table 3.
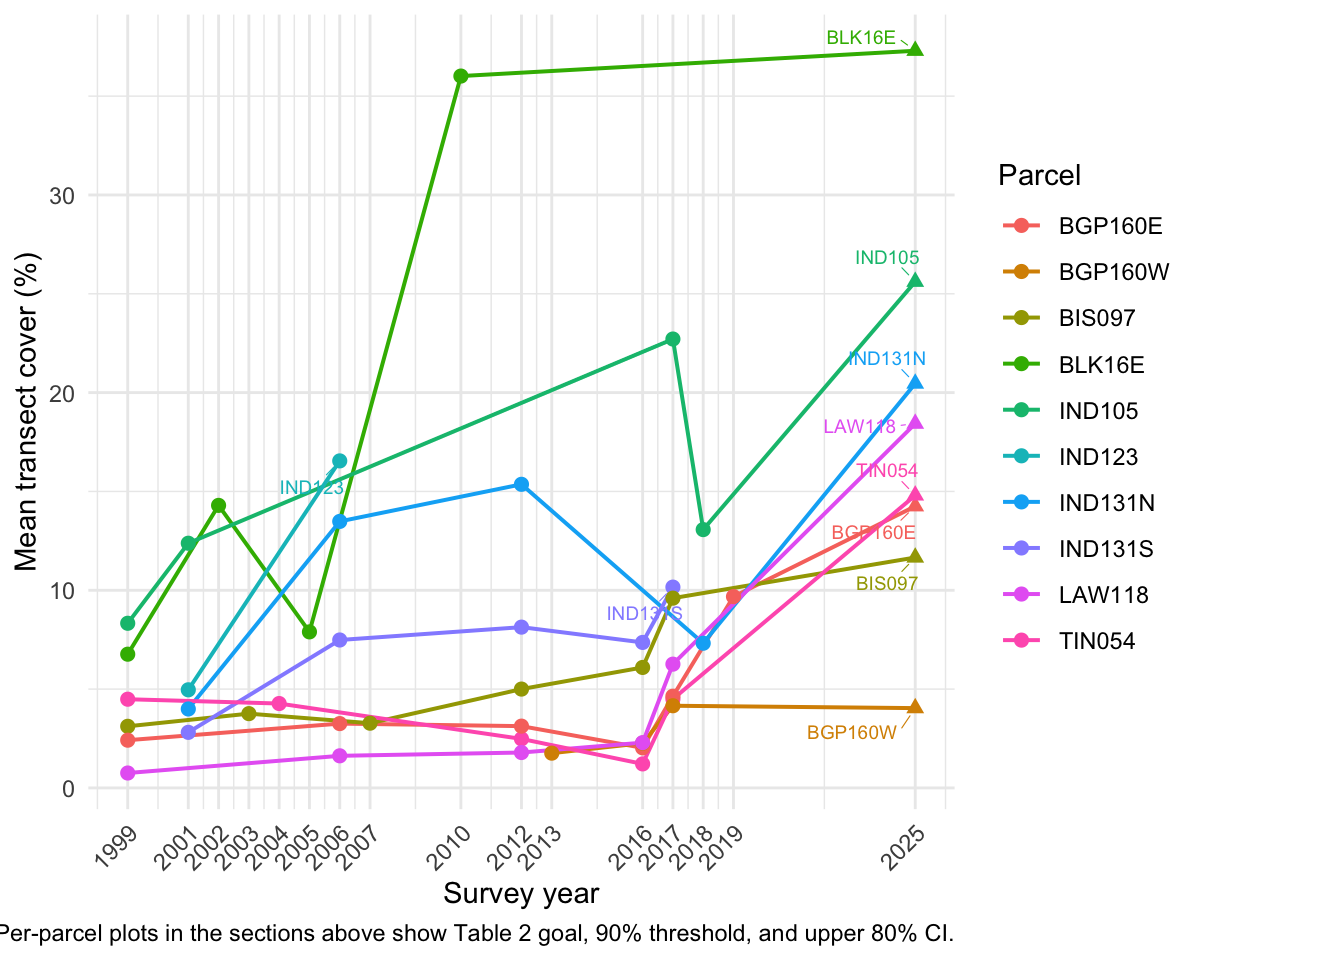
Longitudinal cover summaries parsed from data/raw/LADWP 1991 EIR REVEGETATION DATA-MASTER.xlsm. Cover compliance uses the same upper 80% CI test against 90% of the Table 2 cover goal.
Historical parcel summaries from the LADWP master workbook appear in Table 4; trends are shown in Fig. 7.
Processed outputs in data/processed/:
reveg1999plan_hits_long.csvreveg1999plan_parcel_metadata.csvreveg1999_master_transect_cover.csvreveg1999_master_parcel_summary.csvDenominator lookup: data/transect_segment_denominators.csv (python3 code/build_transect_segment_denominators.py).
Parcel boundaries: mitigation_sites.shp (primary), mitigation_view_polygons.geojson (LAW118), TIN054.json (experimental plot). Transect posts: TIN054_tpost_transects.json → TIN054_transect_posts.csv.
Segment lengths are GIS post-to-post distances (data/transect_segment_denominators.csv) when sheets omit total points. Protocol implies first-hit every 0.5 m; some years may have been tallied per segment without locations—field practice still being confirmed.↩︎
TIN054 posts/segments are omitted from the overview until layout is confirmed (TBD).↩︎
---
title: "1999 Plan Revegetation Monitoring (2025)"
subtitle: "Inyo County Water Department"
affiliation: "Inyo County Water Department"
date: today
author:
- name: Inyo County Water Department
format:
html: default
docx:
toc: true
number-sections: true
pdf:
documentclass: article
geometry:
- margin=1in
fontsize: 11pt
number-sections: true
colorlinks: true
execute:
echo: false
warning: false
message: false
---
::: {.callout-note}
## Scope of this page
**What:** 2025 line-point resurvey of **1991 EIR / 1999 Revegetation Plan** mitigation parcels—cover and composition against Table 2 goals [@LADWP1999].
**Why:** Separate from Laws Type E (2003). Partners need a transparent path from segment hits → site goals. Pages marked *(draft)* elsewhere are prototypes; this report is the working 1999-plan monitoring product.
:::
## Purpose
**Parcels:** IND105, IND123, IND131N/S, BLK16E, TIN054, BGP160E/W, BIS097, and LAW118 (1999-plan context)—not the Type E transfer dashboard ([Laws](index.html) / [reference](reference.html)).
**Cover math:** We use **species hit counts only** from the 2025 workbook; staff `%COV` / `%COMP` columns are ignored. Percent cover = `hits / n_possible_hits × 100`, with `n_possible_hits = segment length (m) / 0.5`.^[Segment lengths are GIS post-to-post distances (`data/transect_segment_denominators.csv`) when sheets omit total points. Protocol implies first-hit every 0.5 m; some years may have been tallied per segment without locations—field practice still being confirmed.]
Goal outcomes: @tbl-goal-summary · map: @fig-overview-map.
## 1999 Revegetation Plan goals
**What the Plan requires** [@LADWP1999]: site-specific live native perennial **cover**, **composition** (species contributing to cover), and **recruitment / sustainability** (≥25% of vegetation cover as natural recruits ≥3 years old).
**What this report scores:** cover and composition from 2025 LPI (with the master-workbook CI rules below). **Sustainability is not scored from LPI alone** here; the LADWP aerial pilot is summarized next as context for that third criterion.
Goals below follow **Table 2** (*2021–22 Mitigation Projects and Status*).
### LADWP proposal — aerial recruitment / sustainability (2026)
**What:** A remote-sensing workflow (high-res imagery + LiDAR → live/dead/bare → interannual overlap) to estimate recruit share of live cover on IND105.
**Why summarize it here:** The Plan’s 25% recruit rule needs an operational definition; this pilot is the current LA proposal. Full deck remains local (`reveg1999plan-docs/`); County dual-track notes in `docs/1999plan_sustainability_monitoring_proposal.md`.
**Why IND105:** cover and composition already met—useful for testing sustainability; **IND123** is also of interest for full completion.
#### Workflow (slides 7–8)
1. Establish “current” vegetation from **0.05 m** imagery + **LiDAR** (August **2022**).
2. Georeference (spline).
3. Object recognition (**eCognition**).
4. **Random Forest** → Bare Ground / Live Vegetation / Dead Vegetation.
5. Merge and explode live polygons.
6. Superimpose year-of-interest live polygons on a prior year.
7. **New recruits** = no overlap with prior live cover, **or** overlapping area **< 10%** of the polygon (also: previously undetectable, **< 0.3 m**).
```{r}
#| label: fig-ladwp-classified-pair
#| fig-cap: "IND105 classified aerials (LADWP): live (green), dead (brown), bare (grey). Left 2022, right 2017 — more live green in 2017."
#| out-width: "100%"
knitr::include_graphics(c(
"images/ladwp-sustainability-2026/09_classified_2022.jpeg",
"images/ladwp-sustainability-2026/09_classified_2017.jpeg"
))
```
#### Recruitment metric and pilot scores
**What:** \(R\) = (recruit live area) / (total live vegetation cover), compared to Plan **≥25%** of vegetation cover—not parcel area [@LADWP1999].
| Epoch | Live cover | Recruit cover | Recruit % of cover | vs 25% |
|-------|------------|---------------|--------------------|--------|
| 2014 vs 2009 | 14.0% | 1.93% | **13.7%** | below |
| 2017 vs 2014 (unadjusted) | 38.9% | 17.0% | **43.8%** | above |
| 2017 adjusted (×0.74 + persist to 2022) | 28.9% | 14.4% | **49.7%** | above |
| 2022 vs 2017 | 11.1% | 1.27% | **11.5%** | below |
```{r}
#| label: fig-ladwp-recruit-2022
#| fig-cap: "New recruitment in 2022 vs 2017 live cover (LADWP): non-intersecting and small-overlap recruit polygons; recruit share 11.5% of 2022 live cover."
#| out-width: "90%"
knitr::include_graphics("images/ladwp-sustainability-2026/10_recruitment_2022.jpeg")
```
```{r}
#| label: fig-ladwp-recruit-2017-adj
#| fig-cap: "Adjusted 2017 recruitment (LADWP): annual correction and persistence filter vs 2022 live/dead; recruit share 49.7% of adjusted cover."
#| out-width: "100%"
knitr::include_graphics(c(
"images/ladwp-sustainability-2026/14_adjusted_2017_a.jpeg",
"images/ladwp-sustainability-2026/14_adjusted_2017_b.jpeg"
))
```
**Annual issue (slide 13):** 2017 RS cannot separate annuals; IND106 T10/T12 (within IND105) had **25.7%** annual hits → scale cover × **0.743**; keep non-intersecting polygons that overlap **2022 live or dead**.
**Caveats from LA watershed resources staff:** Annuals **inflate recruitment area**. If credited as recruitment in 2017 but empty in 2022, drop from the 25% share (annual signal; perennial mortality is an alternate assumption). Lateral growth ≠ recruitment on LPI alone; sample ≠ whole site without a sampling frame.
#### Recommendations (slide 17)
1. Acquire **high-resolution remote sensing (~0.05 m / 5 cm)** **with LiDAR** every **three to five years**. *(Deck text says “< 0.05 cm” — treat as typo for 0.05 m, matching the 2022 acquisition.)*
2. Conduct **ground monitoring concurrently** with RS acquisition.
**Going forward (ICWD):** treat **2022** as baseline; compare expected **2024 3DEP LiDAR** to 2022 and to **2025** transects; refine baseline before the next high-res flight.
**Compliance method** (from `LADWP 1991 EIR REVEGETATION DATA-MASTER.xlsm`): cover is met when the **upper 80% confidence interval** of mean transect cover reaches **90% of the Table 2 cover goal** (`upper CI80 ≥ 0.9 × goal`). Species composition is met when observed richness reaches **75% of the Table 2 species goal**. The 80% CI uses `mean + t₀.₉,ₙ₋₁ × SD / √n` across transects (or segments, for 2025).
This report compares **2025 live native perennial cover**, **upper 80% CI**, and **native perennial species with ≥3 hits** to those targets. Cover and species metrics use the same perennial filter as the LADWP master workbook (`Lifecycle` contains “Perennial”). Parcels with missing segment lengths (denominators) are marked incomplete.
**Parcel boundaries:** AGOL polygons only — no transect buffering. Most parcels use `mitigation_sites.shp`; **LAW118** uses `mitigation_view_polygons.geojson`; **TIN054** uses the experimental plot in `data/gis/TIN054.json`. **TIN054 transect geometry is TBD** (current post pairing draws incorrectly; map left blank until remapped).
## Data loading
```{r load-data}
library(dplyr)
library(DT)
library(leaflet)
library(sf)
library(readr)
library(knitr)
library(ggplot2)
library(ggrepel)
source("code/parse_reveg1999plan_workbook.R")
source("code/parse_reveg1999_master_workbook.R")
source("code/reveg1999plan_maps.R")
data1999 <- load_reveg1999plan_data()
write_reveg1999plan_outputs(data1999)
master_data <- load_reveg1999_master_data()
write_reveg1999_master_outputs(master_data)
hits <- data1999$hits
meta <- data1999$metadata
species_attr <- read_csv("data/species.csv", show_col_types = FALSE)
segment_cover <- summarise_reveg1999_segment_cover(hits, species_attr)
posts_sf <- load_reveg1999_transect_posts()
segment_points <- build_reveg1999_segment_points(segment_cover, posts_sf)
segment_lines <- build_reveg1999_segment_lines(segment_cover, posts_sf)
boundaries <- load_reveg1999_parcel_boundaries()
missing_by_parcel <- hits |>
group_by(parcel) |>
summarise(
n_segment_keys = n_distinct(segment_key),
segments_missing_denom = n_distinct(segment_key[is.na(n_possible_hits)]),
.groups = "drop"
)
parcel_metrics_calc <- compute_reveg1999_parcel_metrics(hits, species_attr) |>
fix_parcel_metrics_denominators(hits)
parcel_metrics <- tibble(parcel = sort(unique(hits$parcel))) |>
left_join(REVEG1999_PARCEL_GOALS, by = "parcel") |>
left_join(meta |> select(parcel, survey_date), by = "parcel") |>
left_join(missing_by_parcel, by = "parcel") |>
left_join(parcel_metrics_calc, by = "parcel", suffix = c("", "_calc")) |>
mutate(
assessment_complete = if_else(
is.na(assessment_complete),
segments_missing_denom == 0L,
assessment_complete
)
) |>
arrange(parcel)
parcel_list <- parcel_metrics$parcel
```
## Goal assessment summary
Compliance against Table 2 cover and composition criteria is shown in @tbl-goal-summary.
```{r}
#| label: tbl-goal-summary
#| tbl-cap: "2025 monitoring versus 1999 Plan goals (upper 80% CI cover test and species composition)."
#| column: screen
goal_display <- parcel_metrics |>
mutate(
cover_status = case_when(
is.na(assessment_complete) | !assessment_complete ~ "Incomplete",
cover_met ~ "Met",
TRUE ~ "Not met"
),
composition_status = case_when(
is.na(assessment_complete) | !assessment_complete ~ "Incomplete",
composition_met ~ "Met",
TRUE ~ "Not met"
),
overall_status = case_when(
is.na(assessment_complete) | !assessment_complete ~ "Incomplete",
overall_met ~ "Met",
TRUE ~ "Not met"
),
live_native_cover_pct = round(live_native_cover_pct, 1),
upper_ci80_pct = round(upper_ci80_pct, 1),
target_cover_pct = round(target_cover_pct, 2),
target_species_richness = round(target_species_richness, 2),
mean_segment_length_m = round(mean_segment_length_m, 1)
) |>
select(
parcel, survey_date, n_segments, mean_segment_length_m,
live_native_cover_pct, upper_ci80_pct, target_cover_pct, cover_status,
n_species_3plus, target_species_richness, composition_status,
overall_status, segments_missing_denom
)
datatable(
goal_display,
colnames = c(
"Parcel",
"Survey date",
"Segments",
"Mean seg. (m)",
"Cover (%)",
"Upper 80% CI",
"Cover target",
"Cover status",
"Species ≥3",
"Species target",
"Composition",
"Overall",
"Missing denom."
),
rownames = FALSE,
elementId = "goal-summary-table",
options = list(
pageLength = 15,
scrollX = TRUE,
scrollCollapse = TRUE,
autoWidth = FALSE,
columnDefs = list(
list(width = "76px", targets = 0),
list(width = "100px", targets = 1),
list(width = "76px", targets = 2),
list(width = "92px", targets = 3),
list(width = "76px", targets = 4),
list(width = "92px", targets = 5),
list(width = "92px", targets = 6),
list(width = "100px", className = "dt-status-col", targets = 7),
list(width = "80px", targets = 8),
list(width = "100px", targets = 9),
list(width = "100px", className = "dt-status-col", targets = 10),
list(width = "92px", className = "dt-status-col", targets = 11),
list(width = "96px", targets = 12)
)
)
)
```
## Overview map
@fig-overview-map shows mitigation **parcel boundaries** (grey fill), **transect segment lines** connecting post pairs, and 2025 posts colored by cover. Click a parcel, line, or post for summary stats. Per-site static maps with post labels follow below.^[**TIN054** posts/segments are omitted from the overview until layout is confirmed (TBD).]
```{r}
#| label: fig-overview-map
#| fig-cap: "Overview of mitigation parcel boundaries, transect segments, and 2025 post cover (TIN054 geometry TBD — omitted)."
#| fig-height: 6
if (nrow(boundaries) > 0 && nrow(segment_points) > 0) {
build_reveg1999_overview_map(
boundaries,
segment_points |> filter(parcel != "TIN054"),
parcel_metrics,
segment_lines |> filter(parcel != "TIN054")
)
} else {
cat("Overview map unavailable — missing parcel boundaries or transect post geometry.")
}
```
## Revegetation sites
Each section shows the mitigation site boundary, transect segment lines, labeled posts (2025 cover), a cover trend plot (Table 2 goal, 90% compliance threshold, upper 80% CI), summary statistics, and goal status.
TOC / jump labels use: **⚠️** = cover + composition met (2025), sustainability not yet demonstrated; **❔** = assessment incomplete; no mark = cover and/or composition not met.
```{r parcel-nav, results='asis'}
toc_mark <- function(p) {
m <- parcel_metrics |> filter(parcel == p)
if (nrow(m) != 1 || isFALSE(m$assessment_complete[1]) || is.na(m$overall_met[1])) {
return("\u2753 ") # ❔ incomplete
}
if (isTRUE(m$overall_met[1])) {
return("\u26a0\ufe0f ") # ⚠️ met cover/comp; sustainability TBD
}
""
}
parcel_nav <- paste0(
"[", vapply(parcel_list, toc_mark, character(1)), parcel_list, "](#",
tolower(parcel_list), ")",
collapse = " · "
)
cat("**Jump to parcel:** ", parcel_nav, "\n\n", sep = "")
```
```{r parcel-profiles, results='asis', fig.width=7, fig.height=5, fig.show='asis'}
goal_icon <- function(met) {
if (is.na(met)) {
return("—")
}
if (met) "\u2705" else "\u274c"
}
for (p in parcel_list) {
m <- parcel_metrics |> filter(parcel == p)
mrow <- if (nrow(m) == 1) m else NULL
meta_row <- meta |> filter(parcel == p)
# Emoji in heading flows into Quarto TOC (sidebar)
cat("\n\n### ", toc_mark(p), p, " {#", tolower(p), "}\n\n", sep = "")
if (nrow(meta_row) == 1) {
cat(
"**Survey date:** ", format(meta_row$survey_date[1], "%Y-%m-%d"),
" · **Quad:** ", coalesce(meta_row$quad[1], "—"),
" · **Mitigation acres (AGOL):** ",
if (nrow(boundaries |> filter(parcel == p)) > 0) {
round(boundaries |> filter(parcel == p) |> pull(acres), 1)
} else {
"—"
},
"\n\n",
sep = ""
)
}
if (!is.null(mrow) && mrow$assessment_complete) {
cat(
"| Metric | 2025 | Target | Status |\n",
"|--------|------|--------|--------|\n",
"| Live native cover (parcel mean) | ", mrow$live_native_cover_pct, "% | ",
round(mrow$cover_goal_pct, 1), "% (Table 2) | — |\n",
"| Upper 80% CI (segment mean) | ",
if_else(is.na(mrow$upper_ci80_pct), "—", paste0(round(mrow$upper_ci80_pct, 1), "%")),
" | ", round(mrow$target_cover_pct, 2), "% | ", goal_icon(mrow$cover_met), " |\n",
"| Native species (≥3 hits) | ", mrow$n_species_3plus, " | ",
round(mrow$target_species_richness, 2), " | ", goal_icon(mrow$composition_met), " |\n",
"| **Overall** | | | **", if (mrow$overall_met) "Met" else "Not met", "** |\n\n",
sep = ""
)
} else {
cat(
"**Assessment incomplete** — ",
coalesce(mrow$segments_missing_denom[1], NA), " segment(s) lack GIS length/denominator.\n\n",
sep = ""
)
}
cat("**Map:** parcel boundary (grey), transect segments (lines), and posts colored by 2025 percent cover.\n\n")
if (identical(p, "TIN054")) {
cat(
"::: {.callout-note}\n\n",
"## TIN054 transect map — TBD\n\n",
"Post/segment pairing is not reliable yet, so the site map is omitted. ",
"Cover tables and trend still show; geometry will be added when the layout is confirmed.\n\n",
":::\n\n",
sep = ""
)
} else {
p_map <- plot_reveg1999_parcel_map(
p, boundaries, segment_points, mrow, segment_lines
)
if (!is.null(p_map)) {
print(p_map)
} else {
cat("_Map unavailable for this parcel (missing posts or boundary)._\n\n")
}
}
cat("\n\n**Cover trend:** mean cover with upper 80% CI; dashed line = Table 2 goal; red line = 90% compliance threshold.\n\n")
p_trend <- plot_reveg1999_parcel_cover_history(p, master_data$parcel_summary, mrow)
print(p_trend)
cat("\n\n")
}
```
## Segment cover (all parcels)
Segment-level cover (@tbl-segment-cover) uses GIS post-to-post lengths as the hit denominator.
```{r}
#| label: tbl-segment-cover
#| tbl-cap: "2025 segment-level cover computed from hits and GIS segment length."
segment_cover |>
filter(!is.na(n_possible_hits)) |>
mutate(
length_m = round(length_m, 1),
segment_cover_pct = round(segment_cover_pct, 2)
) |>
arrange(parcel, segment_key) |>
datatable(
rownames = FALSE,
options = list(pageLength = 20, scrollX = TRUE)
)
```
## Species hits
Raw species hits by segment are listed in @tbl-species-hits.
```{r}
#| label: tbl-species-hits
#| tbl-cap: "Species hit counts by parcel and segment (2025 raw field data)."
hits_display <- hits |>
left_join(species_attr, by = c("species" = "Code")) |>
select(
parcel, segment_key, species, CommonName, Lifeform, Lifecycle,
hits, length_m, n_possible_hits, percent_cover
) |>
mutate(
length_m = round(length_m, 1),
percent_cover = round(percent_cover, 2)
)
datatable(
hits_display,
colnames = c(
"Parcel",
"Segment",
"Species",
"Common name",
"Lifeform",
"Lifecycle",
"Hits",
"Length (m)",
"Possible hits",
"Cover (%)"
),
rownames = FALSE,
filter = "top",
elementId = "species-hits-table",
options = list(
pageLength = 25,
scrollX = TRUE,
autoWidth = FALSE,
columnDefs = list(
list(width = "72px", targets = 0),
list(width = "80px", targets = 1),
list(width = "64px", targets = 2),
list(width = "150px", className = "dt-wrap-col", targets = 3),
list(width = "72px", targets = 4),
list(width = "80px", targets = 5),
list(width = "48px", targets = 6),
list(width = "72px", targets = 7),
list(width = "96px", targets = 8),
list(width = "72px", targets = 9)
)
)
)
```
## Historical monitoring (1999–2017)
Longitudinal cover summaries parsed from `data/raw/LADWP 1991 EIR REVEGETATION DATA-MASTER.xlsm`. Cover compliance uses the same upper 80% CI test against 90% of the Table 2 cover goal.
Historical parcel summaries from the LADWP master workbook appear in @tbl-historical-cover; trends are shown in @fig-historical-cover.
```{r}
#| label: tbl-historical-cover
#| tbl-cap: "Historical parcel cover summaries from the LADWP master workbook."
master_display <- master_data$parcel_summary |>
filter(!is.na(mean_cover_pct)) |>
mutate(
mean_cover_pct = round(mean_cover_pct, 1),
upper_ci80_pct = round(upper_ci80_pct, 1),
target_cover_pct = round(target_cover_pct, 2),
cover_met = if_else(cover_met, "Met", "Not met"),
species_richness_met = if_else(species_richness_met, "Met", "Not met")
) |>
select(
parcel, survey_year, n_transects, mean_cover_pct, upper_ci80_pct,
target_cover_pct, cover_met, species_richness, target_species_richness,
species_richness_met
) |>
arrange(parcel, survey_year)
datatable(
master_display,
rownames = FALSE,
options = list(pageLength = 20, scrollX = TRUE)
)
```
```{r}
#| label: fig-historical-cover
#| fig-cap: "Mean transect cover by survey year (LADWP master workbook and 2025 resurvey)."
#| fig-height: 5
cover_2025 <- parcel_metrics |>
filter(assessment_complete) |>
transmute(
parcel,
survey_year = 2025L,
mean_cover_pct = mean_segment_cover_pct
)
historical_plot_data <- bind_rows(
master_data$parcel_summary |>
select(parcel, survey_year, mean_cover_pct),
cover_2025
) |>
filter(!is.na(mean_cover_pct))
label_data <- historical_plot_data |>
group_by(parcel) |>
slice_max(survey_year, n = 1, with_ties = FALSE) |>
ungroup()
ggplot(historical_plot_data, aes(x = survey_year, y = mean_cover_pct, color = parcel, group = parcel)) +
geom_line(linewidth = 0.7) +
geom_point(aes(shape = survey_year == 2025), size = 2) +
scale_shape_manual(values = c(`TRUE` = 17, `FALSE` = 19), guide = "none") +
geom_text_repel(
data = label_data,
aes(label = parcel, color = parcel),
size = 2.5,
show.legend = FALSE,
max.overlaps = Inf,
min.segment.length = 0,
box.padding = 0.4,
point.padding = 0.35,
segment.size = 0.2,
force = 1.5,
direction = "both",
seed = 42
) +
scale_x_continuous(breaks = sort(unique(historical_plot_data$survey_year))) +
coord_cartesian(clip = "off") +
labs(
x = "Survey year",
y = "Mean transect cover (%)",
color = "Parcel",
caption = "Per-parcel plots in the sections above show Table 2 goal, 90% threshold, and upper 80% CI."
) +
theme_minimal(base_size = 11) +
theme(
axis.text.x = element_text(angle = 45, hjust = 1),
plot.margin = margin(5.5, 60, 5.5, 5.5)
)
```
## Data downloads
Processed outputs in `data/processed/`:
- `reveg1999plan_hits_long.csv`
- `reveg1999plan_parcel_metadata.csv`
- `reveg1999_master_transect_cover.csv`
- `reveg1999_master_parcel_summary.csv`
Denominator lookup: `data/transect_segment_denominators.csv` (`python3 code/build_transect_segment_denominators.py`).
Parcel boundaries: `mitigation_sites.shp` (primary), `mitigation_view_polygons.geojson` (LAW118), `TIN054.json` (experimental plot). Transect posts: `TIN054_tpost_transects.json` → `TIN054_transect_posts.csv`.